← Projects
Practice
Practising data insights posts
I’m learning to write data insights posts. I studied how the best person at it works, worked out who CB Insights sells to and what they want to know, then went looking for CB Insights numbers that answer their questions. Twenty-four ideas, five written out in full, every number sourced.
819Peter Walker posts studied
138CB Insights posts read
24post ideas
77numbers, each sourced
What I studied
- Peter Walker’s posts. All 819 of his Carta LinkedIn posts, January 2023 to July 2026, from Carta’s public archive. I tagged each one for its hook, structure, caveats, ending and key number.
- Insightfull. Peter’s Substack on why companies build insights teams, who to hire for them, and how to make a chart in under five minutes.
- CB Insights’ reports. State of Venture Q3’26, State of AI Q2’26, their AI agent ROI research, their top 20 AI agent startups by revenue and the Venture Capital Funnel. Every number on this page comes from one of them.
- CB Insights’ LinkedIn. Their last 138 posts, to see what works for them and to avoid ideas they had already run. Their own charts set the colours and layout for mine.
Who CB Insights is for
I started with the reader, not the data. CB Insights sells to four groups. Each pays for data the others don’t need, and each has a question they keep asking. I wrote the question down first, then went looking for a CB Insights number that answered it.
Investors
“What are the odds, and is the market turning?”
VCs and LPs. They pay for funding rounds, valuations and exits, and they want base rates to argue with.
CHARTS 01 · 02 · 06 · 08 · 13 · 14 · 17 · 19 · 21 · 22
Corp dev and M&A
“Who is buying, what does it cost, and how early?”
The people who buy startups. They pay for M&A data, acquirer lists and revenue multiples.
CHARTS 04 · 10 · 12 · 15 · 16 · 24
Corporate strategy
“Where is everyone else placing their bets?”
Strategy and innovation teams at big companies. They pay for business relationships, strategy maps and market maps.
CHARTS 05 · 07 · 09 · 18 · 23
Enterprise tech buyers
“Is AI paying off, and which vendors will last?”
The people picking AI vendors. They pay for buyer surveys, Commercial Maturity scores and vendor profiles.
CHARTS 03 · 11 · 20
How I worked
Nine steps, from studying the best to asking for feedback.
Study the best
Read and tagged all 819 of Peter Walker’s posts, and read his Substack. About 4.5 posts a week, around 240 words, one chart, one claim.
Out: his rules and his post structureStudy CB Insights
Who buys from them, what data only they have, and every one of their last 138 LinkedIn posts. Their reach comes from people, not the company page. Nothing from the State of Venture Q3’26 report had been posted.
Out: four customer groups and the gapsAsk their questions
For each customer group, the questions they keep asking. Curiosity first, data second.
Out: twenty-four questionsFind the data
Went through CB Insights’ public reports for numbers that answer each question. Seventeen had a public answer. Seven need the platform, so they stay as sketches. The last four slice one report several ways, so each chart carries more data.
Out: 17 charts with data, 7 sketchesCheck every number
Each number saved in a CSV with its source and link. Where a news site summarised a gated report, I checked it against CB Insights’ own figures. Caught one error: a 22% M&A fall was quarter on quarter, not against Q4 2025.
Out: 77 numbers, each with a sourceMatch their look
Read the colours straight from the pixels of their Q3’26 chart and matched the layout. Their logo is never used.
Out: teal #007A8F, grey #A6A6A6, panel #EBEBEBBuild the charts
Four rounds. Too much text, then clean but in my colours, then CB Insights’ colours. The fourth copies how Peter frames and annotates his charts, in their teal and wine. One script builds every chart from the CSVs, so a number only lives in one place.
Write the posts
Five written out in Peter’s structure, below. The other nineteen get one line each.
Out: five postsReview and ask
Checked everything against his rules, wrote down where I fall short, and asked for feedback.
Out: this page
How Peter writes a post
Most of his 819 posts follow the same shape. These are his habits, not mine. I’m practising them.
Line oneThe claim, often with the number in it. Sometimes he names the reader first: “Founders -- ”.
The setupOne or two short lines on why it matters, then “chart below shows” and what is plotted.
The numbersOne per line. Easy to skim.
What this meansTwo or three short points. Facts and guesses kept apart.
CaveatsSample, period, what the data can’t show. In plain English, not hidden at the end.
The closeA question he answers himself, or one blunt line. “Is this a good thing? No, probably not.”
The chartOne idea, same frame every time, labelled directly. The type changes with the data: bars, indexed lines, stacked shares, bubbles, cohort heatmaps.
Five posts, written out
The chart and the words I’d post with it.
01 · For investors
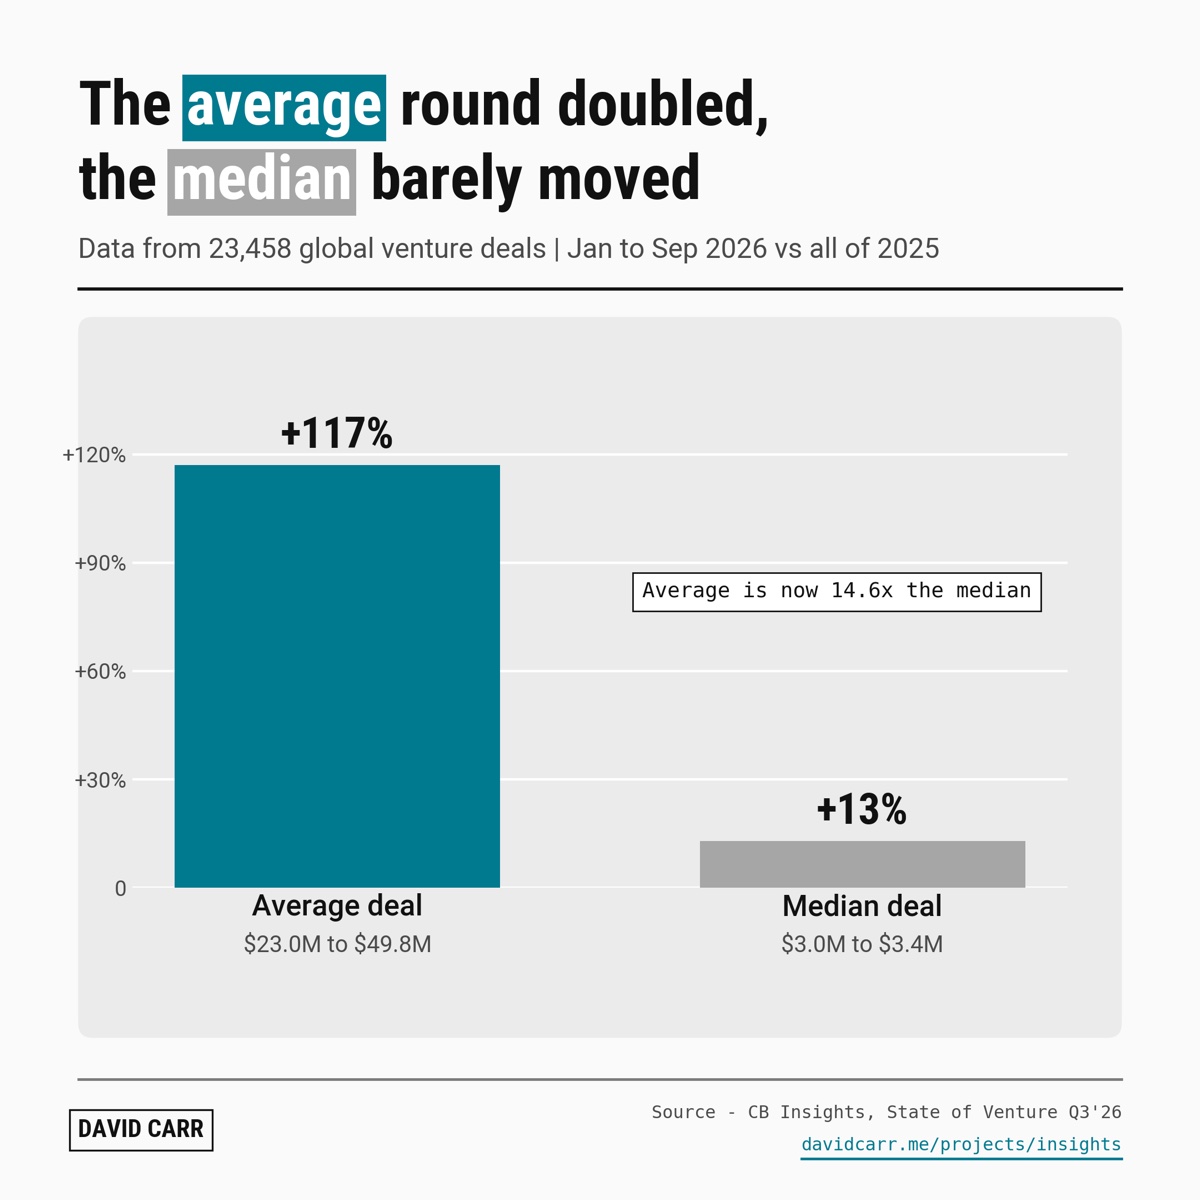
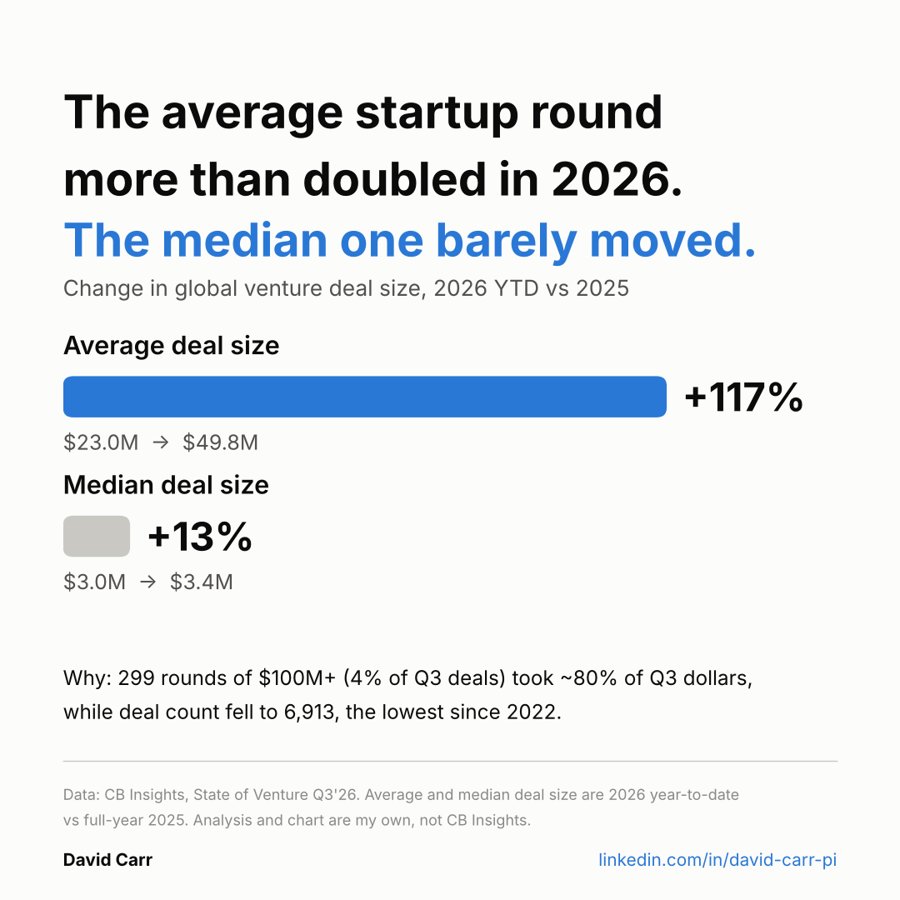
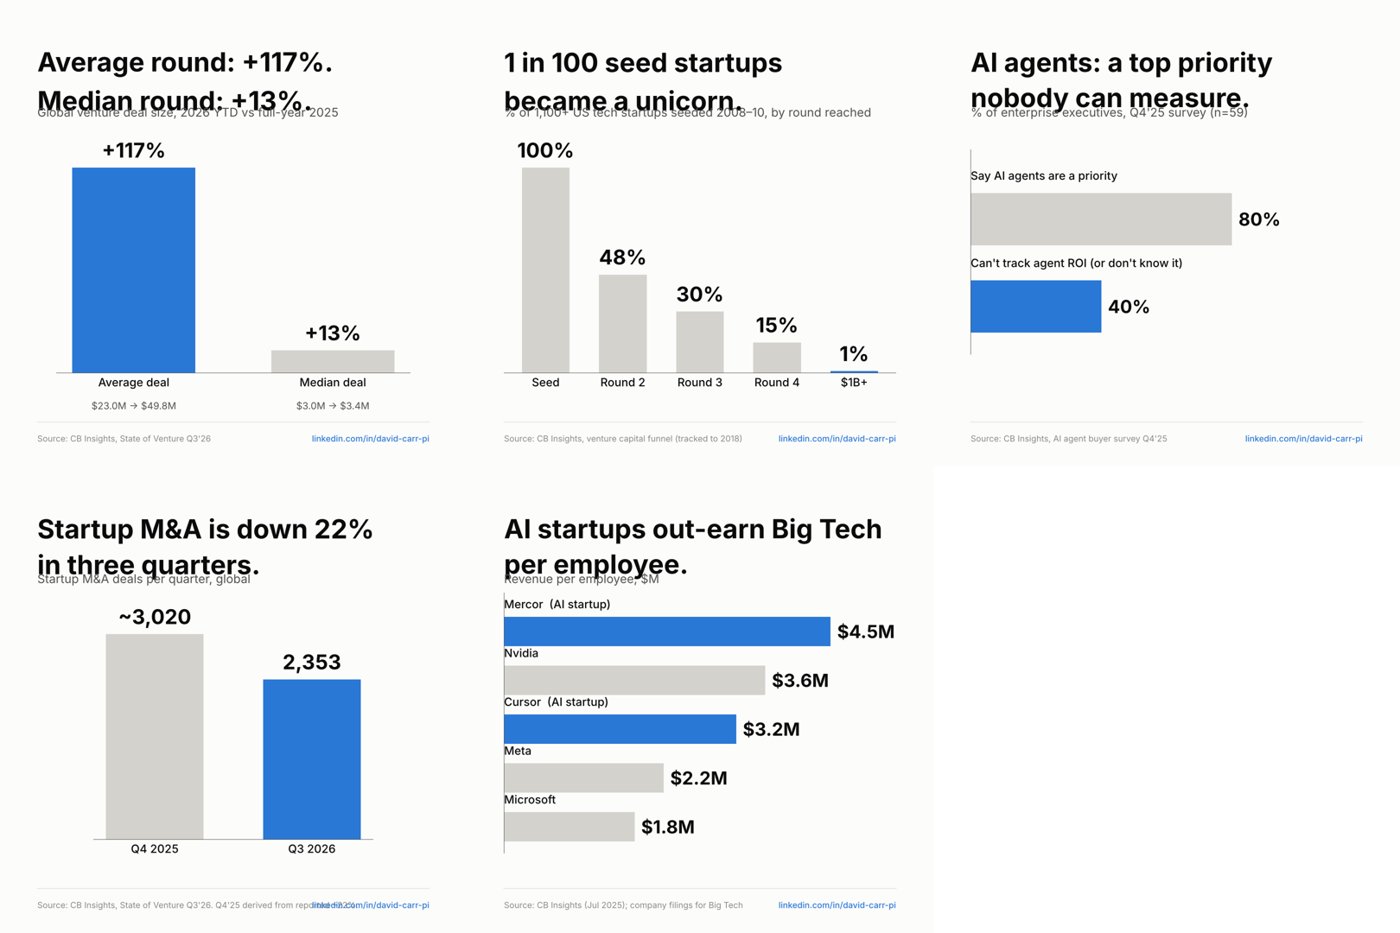
The average venture round more than doubled this year. The median round barely moved.
Chart below shows the change in both, 2026 so far against 2025.
Average deal: $23.0M to $49.8M (+117%)
Median deal: $3.0M to $3.4M (+13%)
What this means
A few huge rounds are pulling the average up. In Q2, 89% of AI money went to just 142 mega-rounds.
The typical startup is raising about what it raised last year. When a headline says deal sizes doubled, that’s true for a handful of companies.
Global deals, 2026 to 30 September vs all of 2025. Figures from a news summary of CB Insights’ State of Venture Q3’26.
So is the market back? For a few companies. For most, not yet.
Source: CB Insights, State of Venture Q3’26 via BeBeez · CSV
02 · For investors
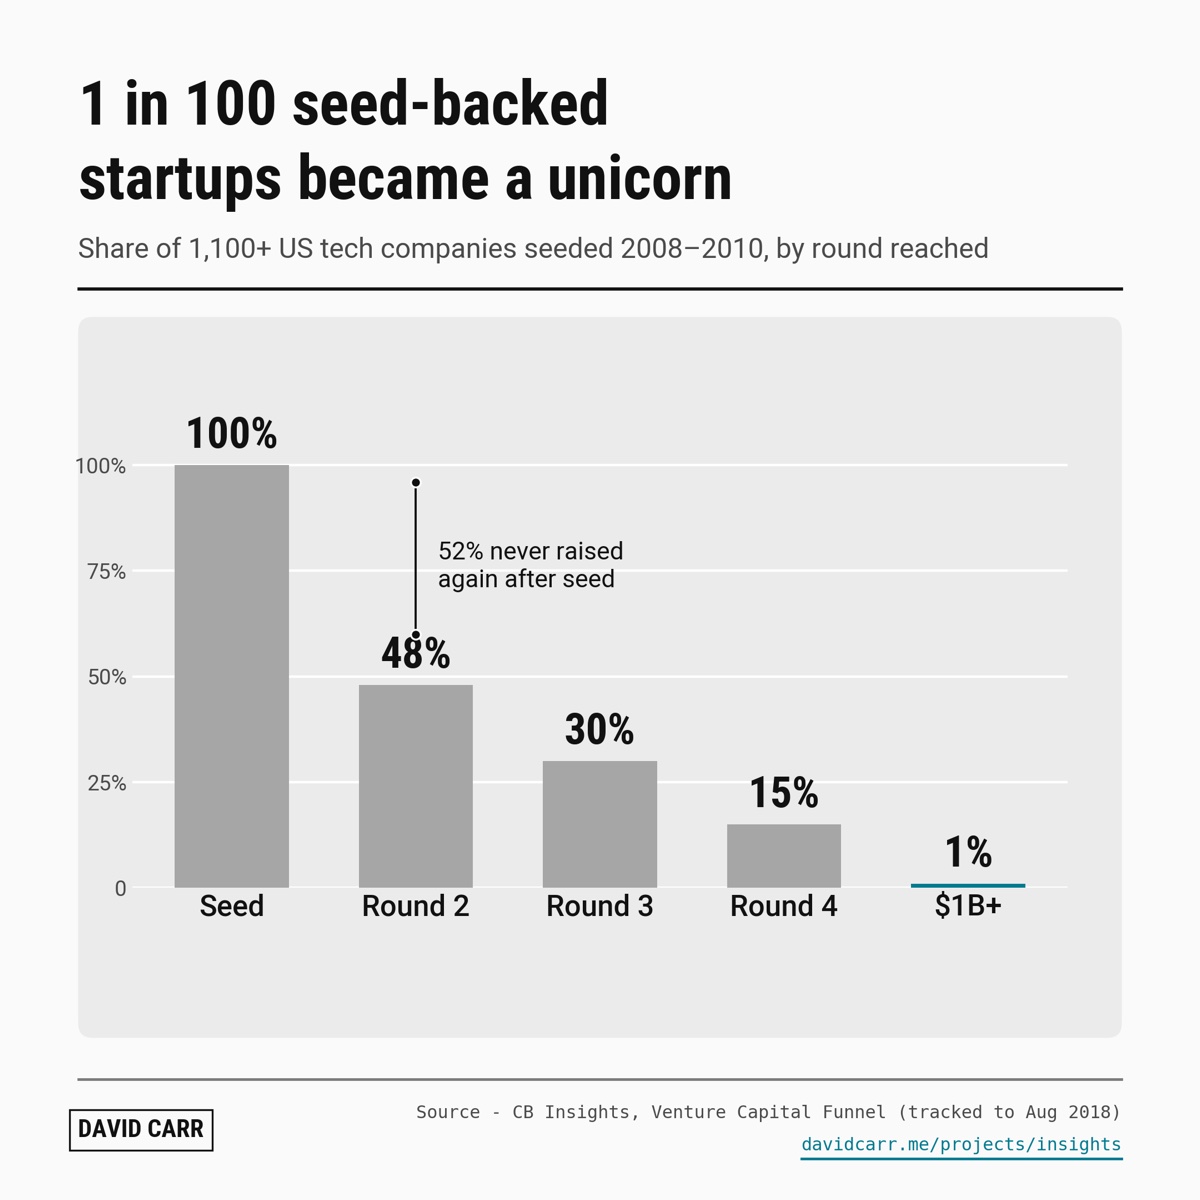
How many seed-backed startups become unicorns? About 1 in 100.
CB Insights followed 1,100+ US tech companies that raised a seed round between 2008 and 2010. Chart below shows how far they got.
48% raised a second round
30% raised a third
15% raised a fourth
1% (12 companies) reached $1B
What this means
More than half never raised again after their seed round.
The biggest drop is the last one: from 15% raising a fourth round to 1% reaching $1B.
Caveat up front: this cohort is old. It was tracked to August 2018, and it’s the latest version CB Insights has made public. The same chart for the Class of 2018 would show if the odds have changed.
The odds are long. That is how venture works.
Source: CB Insights, Venture Capital Funnel · CSV
03 · For enterprise tech buyers
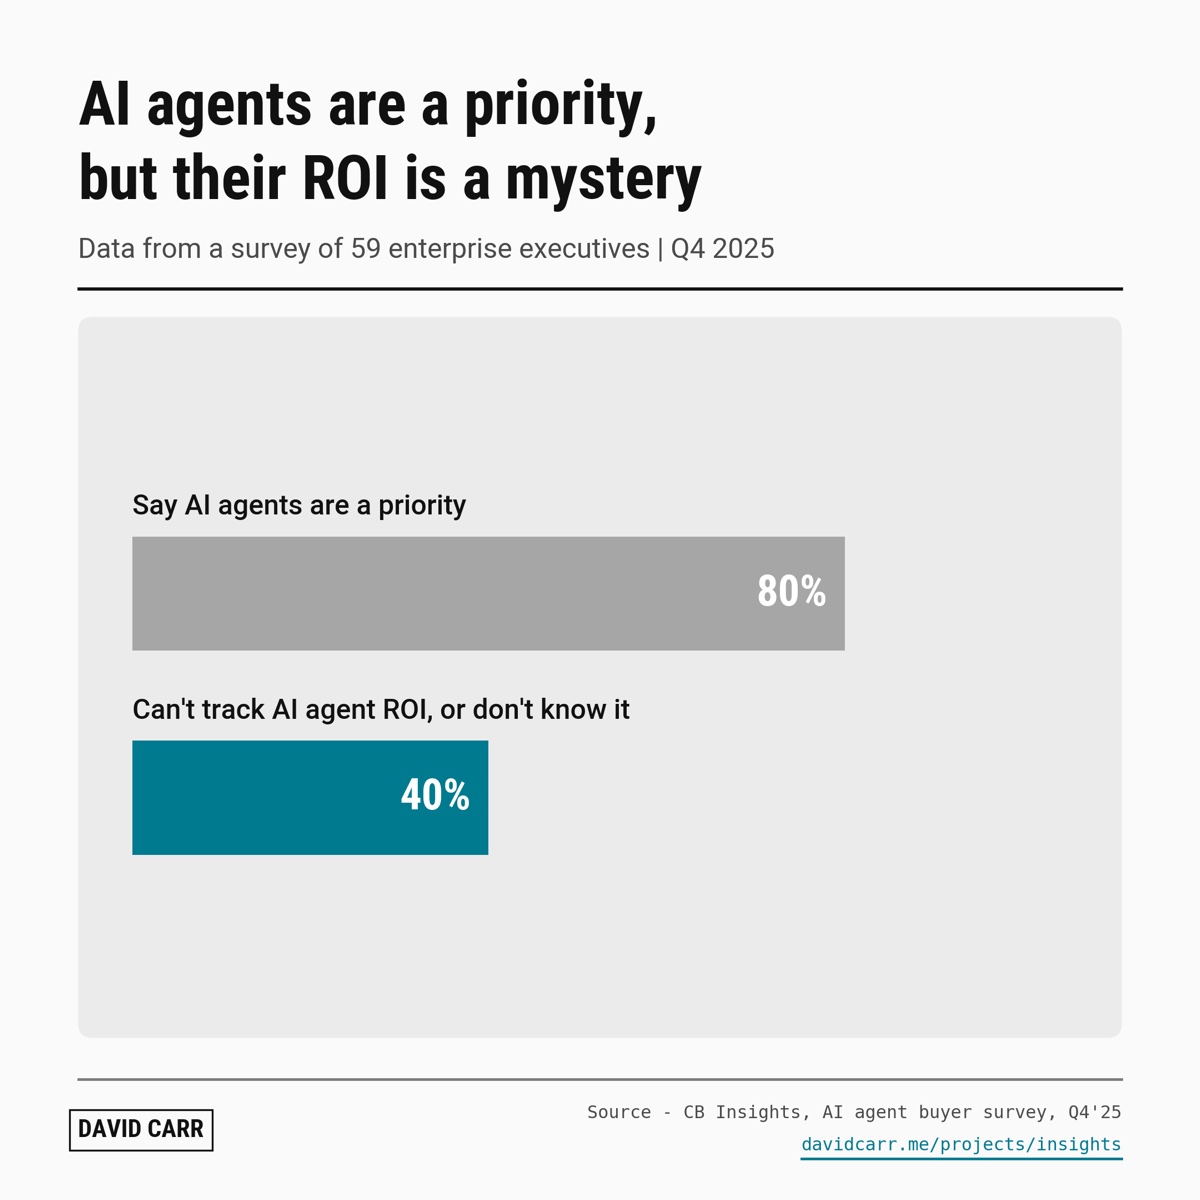
80% of executives say AI agents are a priority. 40% can’t say what they get back from them.
Chart below is from a CB Insights survey of 59 enterprise executives in Q4 2025.
What this means
Two in five companies are spending on something they can’t yet measure.
That won’t last. When budgets get tight, the projects with numbers attached keep their funding.
My guess: the AI vendors who help buyers measure the return will win the next round of deals.
59 people is a small sample. Read it as a signal.
Saying something is a priority is easy. Showing what it’s worth is harder.
Source: CB Insights, What’s next for AI agent ROI · CSV
04 · For corp dev
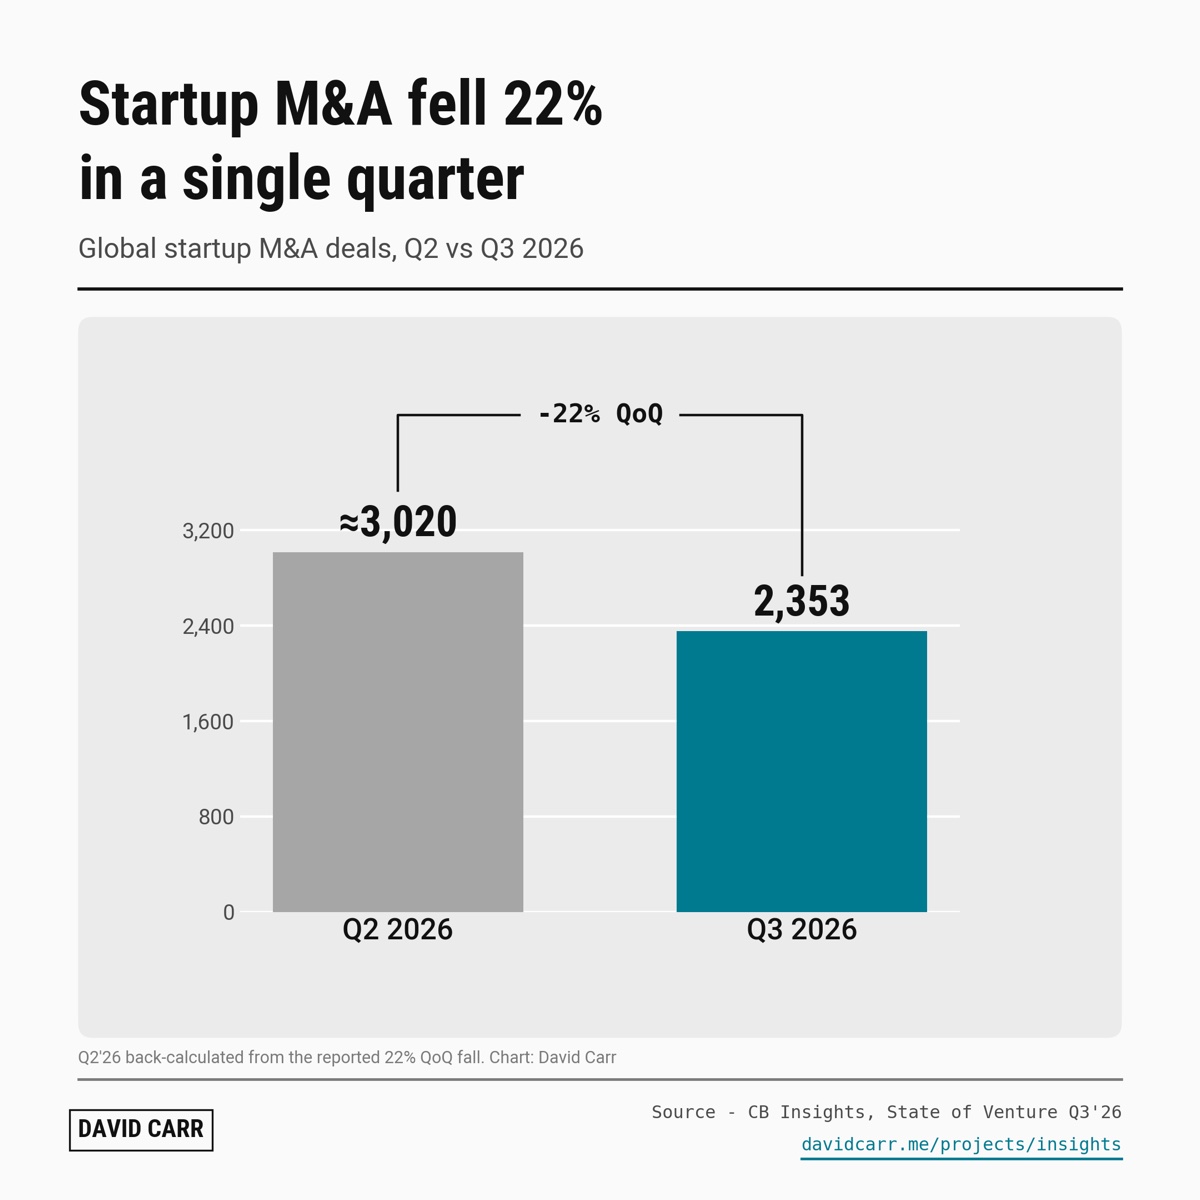
Startup M&A fell 22% in a single quarter.
2,353 startups were acquired in Q3 2026. CB Insights calls it a four-year low.
Chart below compares Q2 and Q3. Q2 is about 3,020, which I worked out from the 22% fall.
What this means
Fewer buyers at the table. If you’re still buying, there’s less competition for each deal.
If you’re a founder hoping to sell, the exit door just got narrower.
The Q3 count comes from a news summary of the report. That summary also said the 22% fall was against Q4 2025. CB Insights’ own page says quarter on quarter, so I went with that.
Good time to buy a startup? If you have the cash, probably yes.
Source: CB Insights, State of Venture Q3’26 · CSV
05 · For corporate strategy
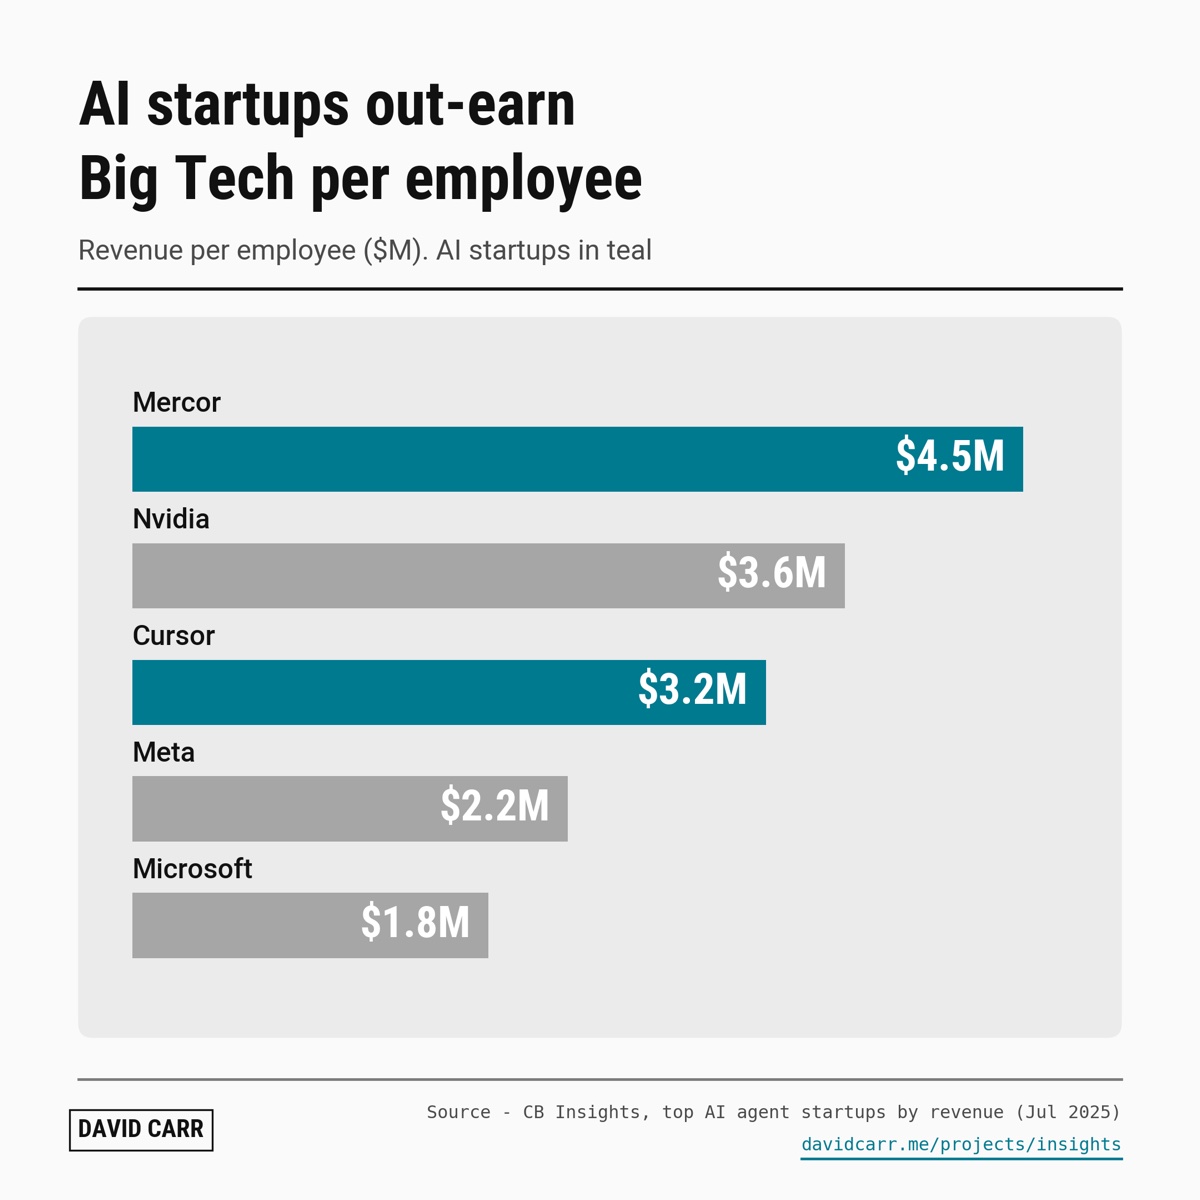
Mercor makes $4.5M in revenue per employee. Nvidia makes $3.6M.
Chart below puts two AI startups next to three of the biggest companies in tech.
Mercor: $4.5M
Nvidia: $3.6M
Cursor: $3.2M
Meta: $2.2M
Microsoft: $1.8M
What this means
A young AI company can earn more per person than Meta or Microsoft.
If you size up a competitor by its headcount, you’ll underrate the AI ones.
Startup figures are from CB Insights’ July 2025 ranking of AI agent startups. Big Tech figures are the benchmarks CB Insights quoted (FY2024 and FY2025). Small, young teams flatter this number.
Small teams, big revenue. Expect more of it.
Source: CB Insights, AI agent startups top 20 by revenue · CSV
Fifteen more ideas
One line each on why it’s worth posting. Eight use public CB Insights numbers. Seven are sketches: the question and the chart shape, but the numbers need the CB Insights platform, so I haven’t made any up.
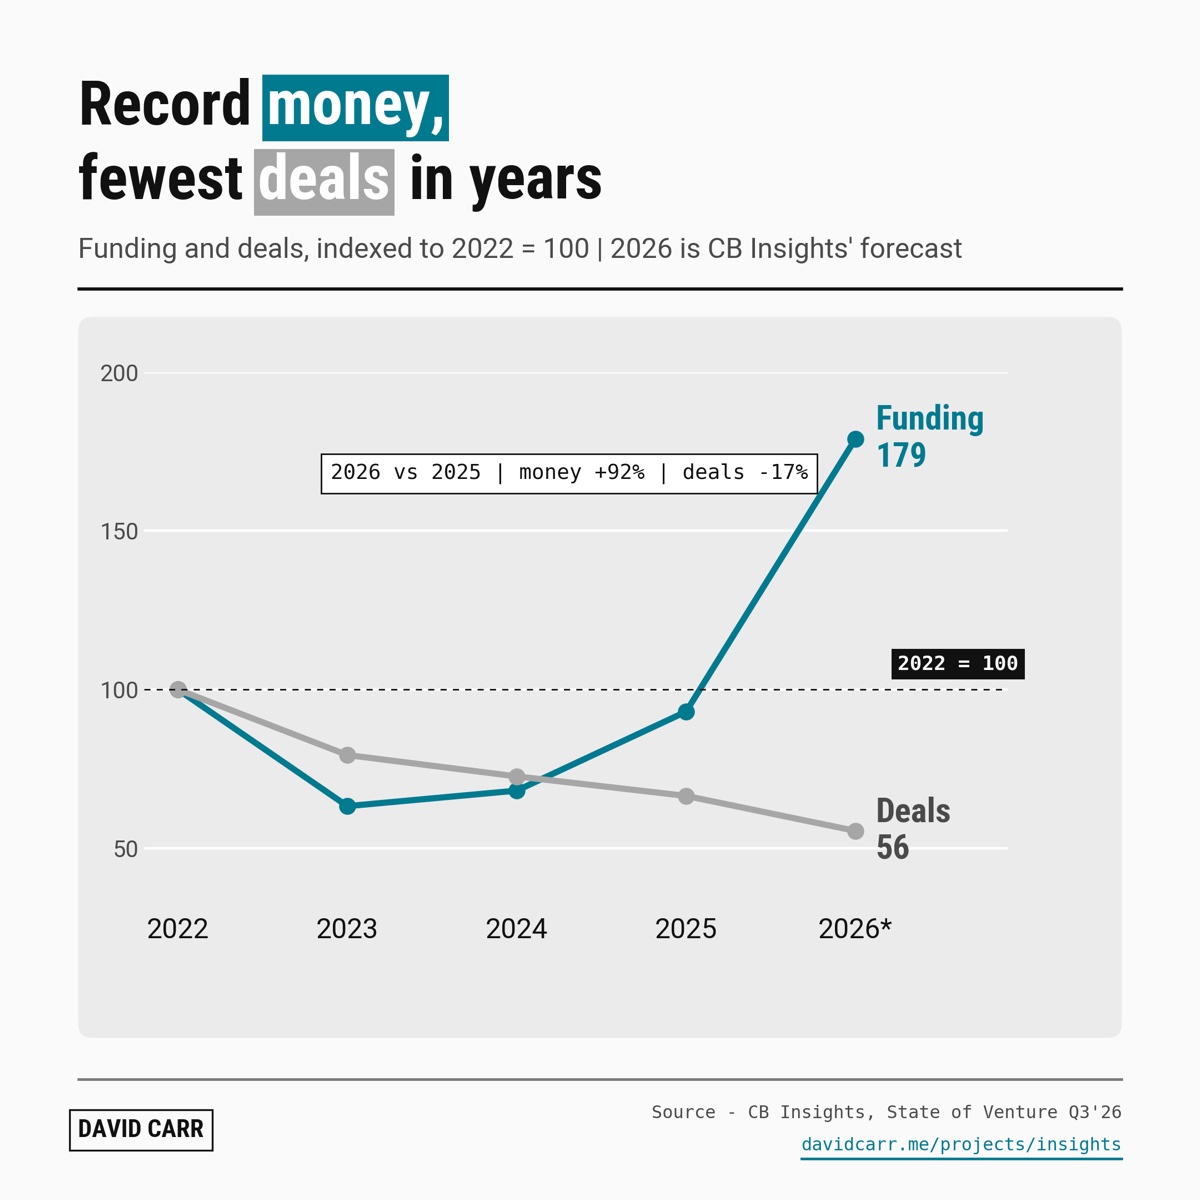 06 · Record money, fewest deals in yearsFunding is on track for 179 against 2022. Deals, 56. More money is chasing fewer companies, so it’s harder for everyone outside the top.
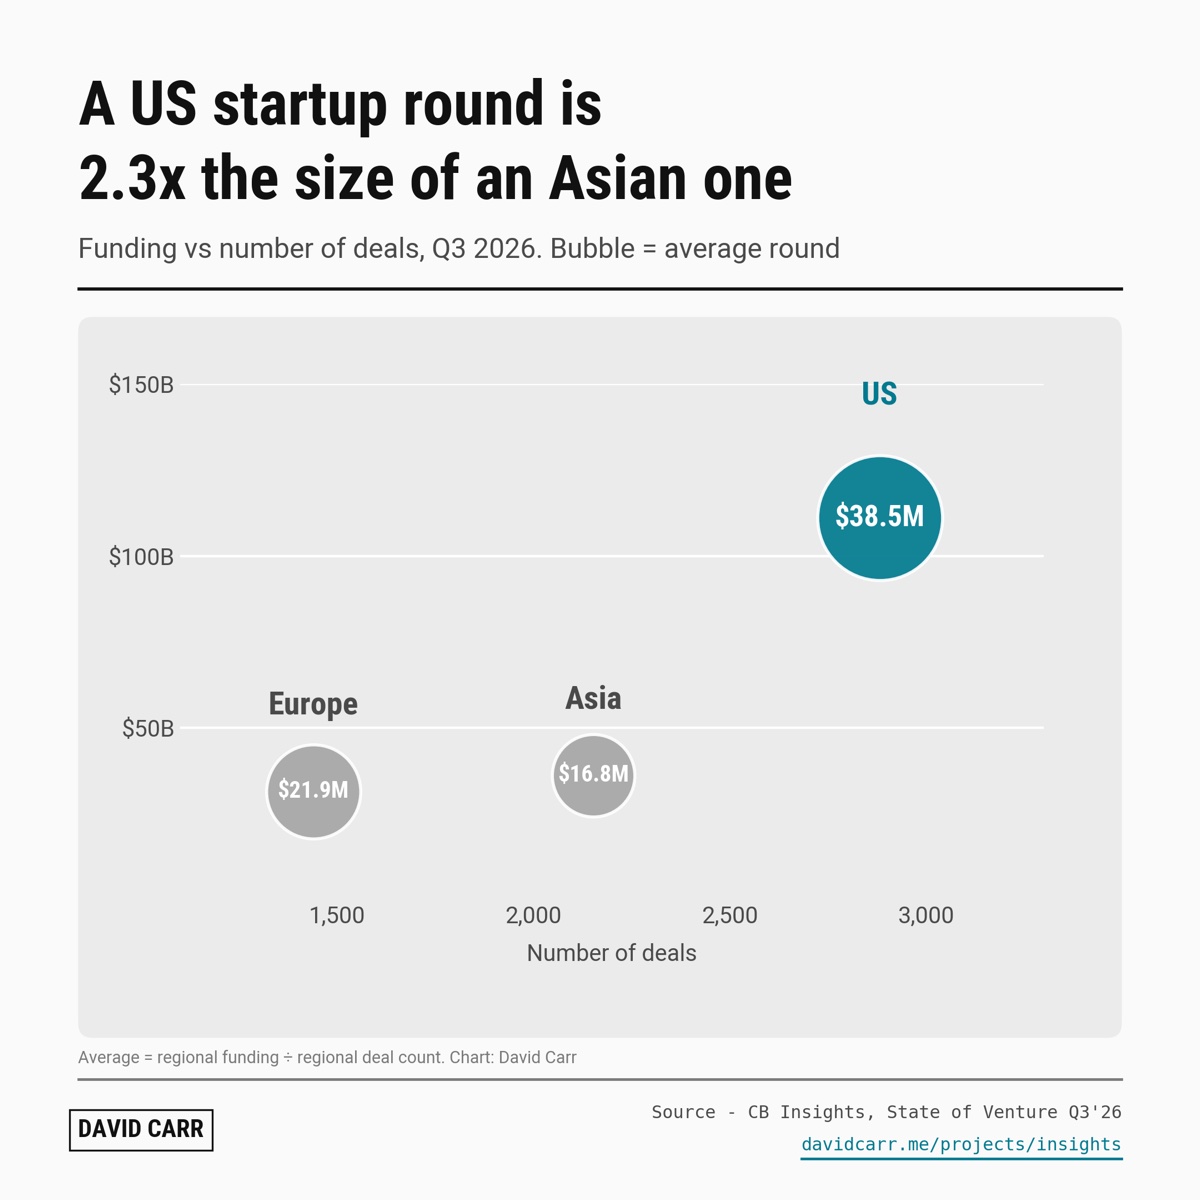 07 · A US round is 2.3x the size of an Asian oneSame quarter, same report. Better companies, or just more money chasing them? Every region will have an opinion.
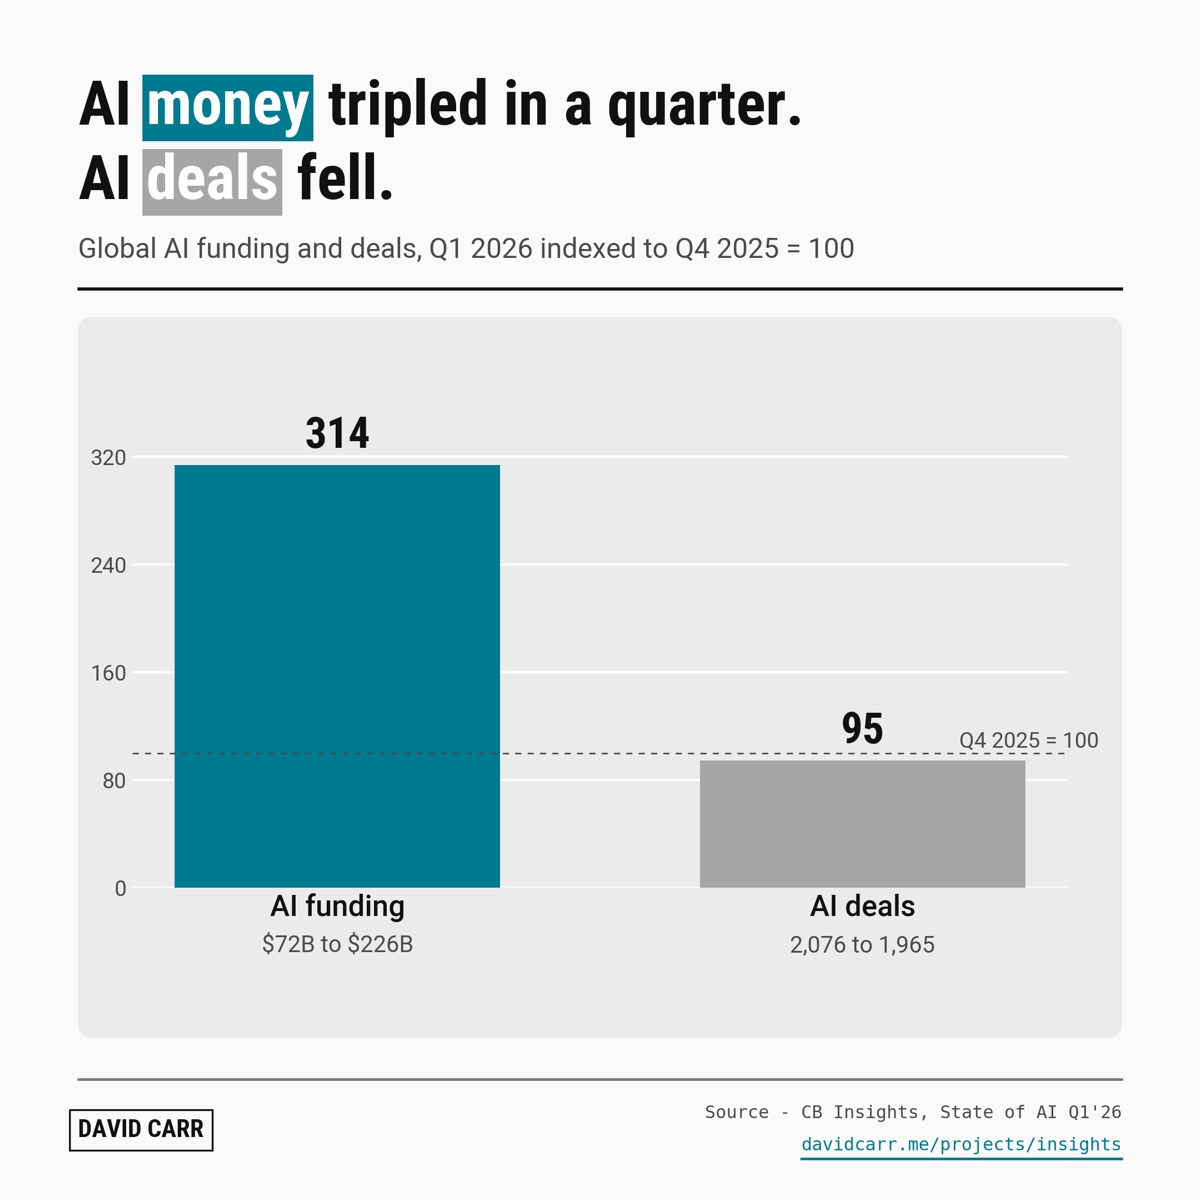 08 · AI money tripled in a quarter. AI deals fell.$72B to $226B, while the number of deals went down. The money is going to fewer, bigger bets.
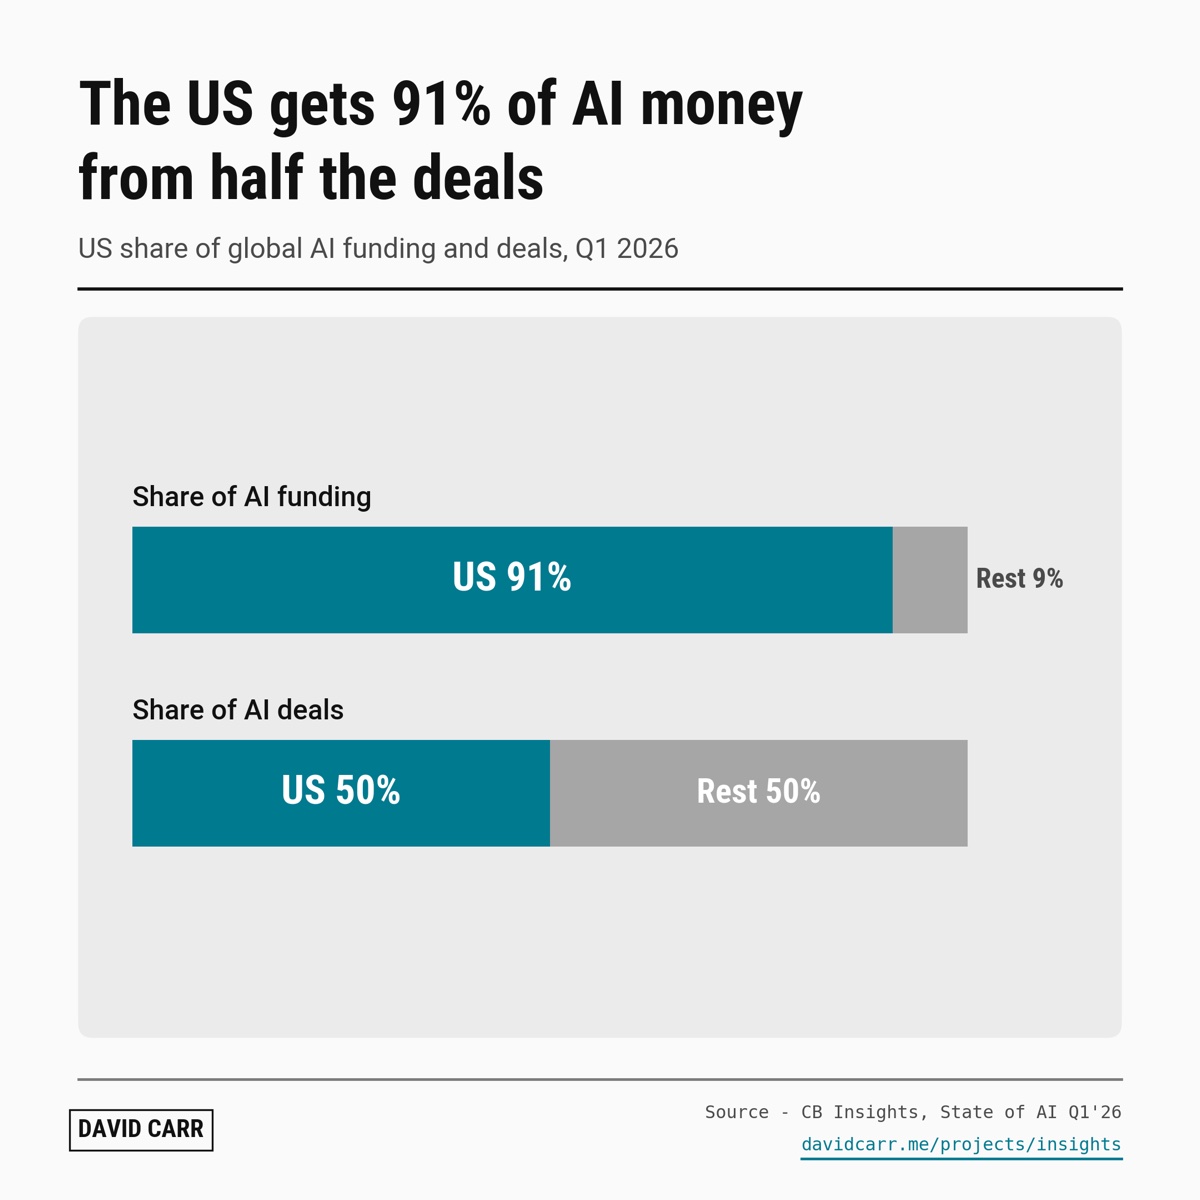 09 · The US gets 91% of AI money from half the dealsThe rest of the world does as many AI deals as the US. Theirs are just much smaller.
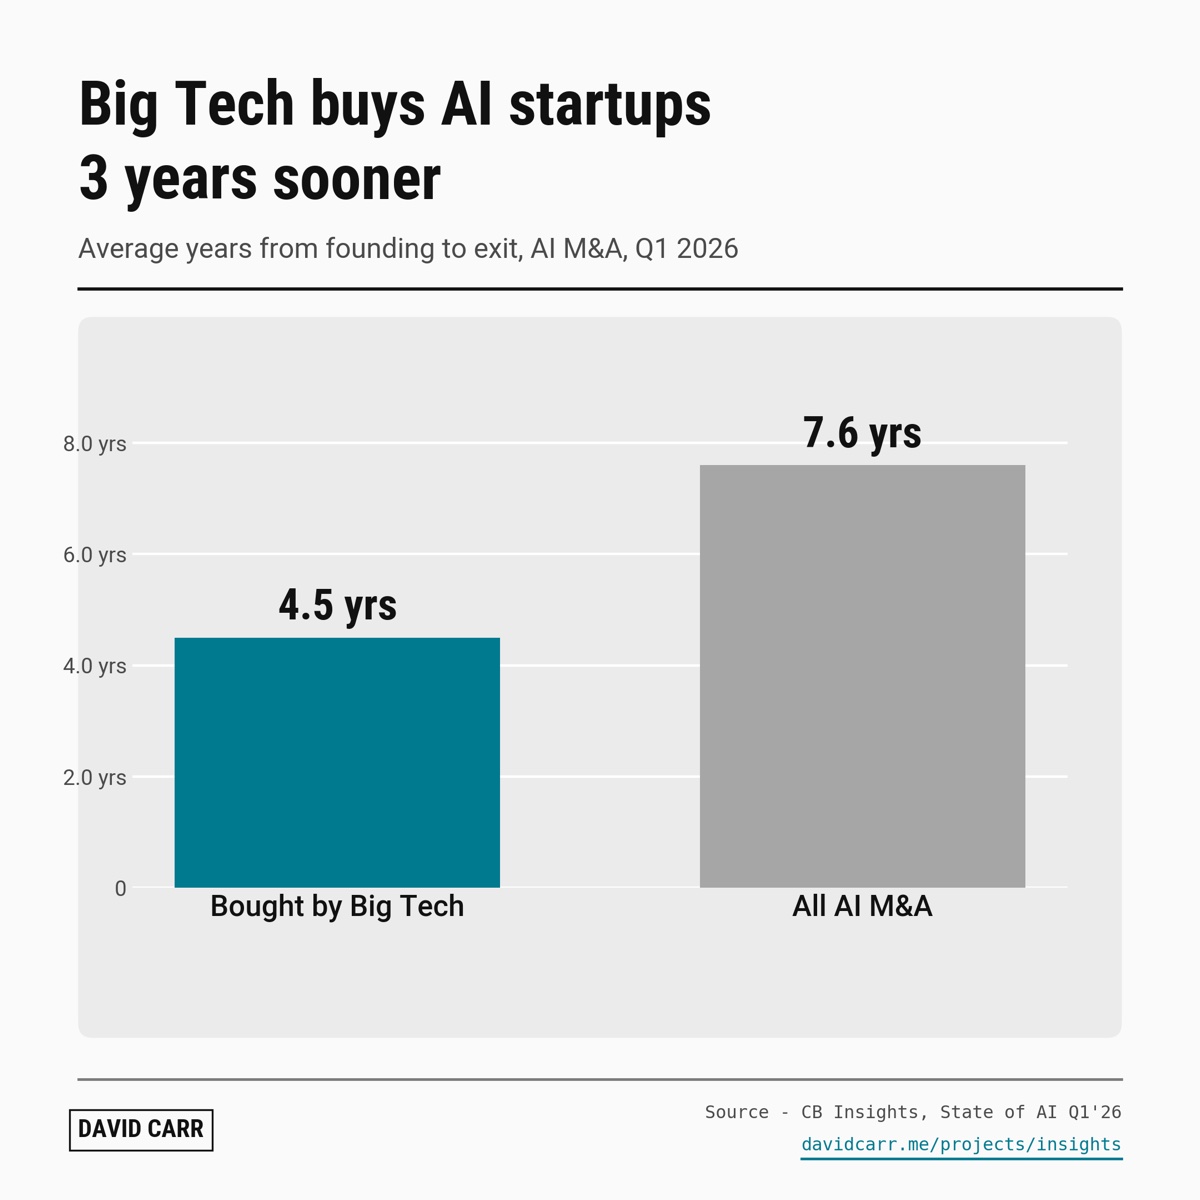 10 · Big Tech buys AI startups 3 years sooner4.5 years from founding against 7.6 for everyone else. If you’re in corp dev, you’re competing with Big Tech for younger companies.
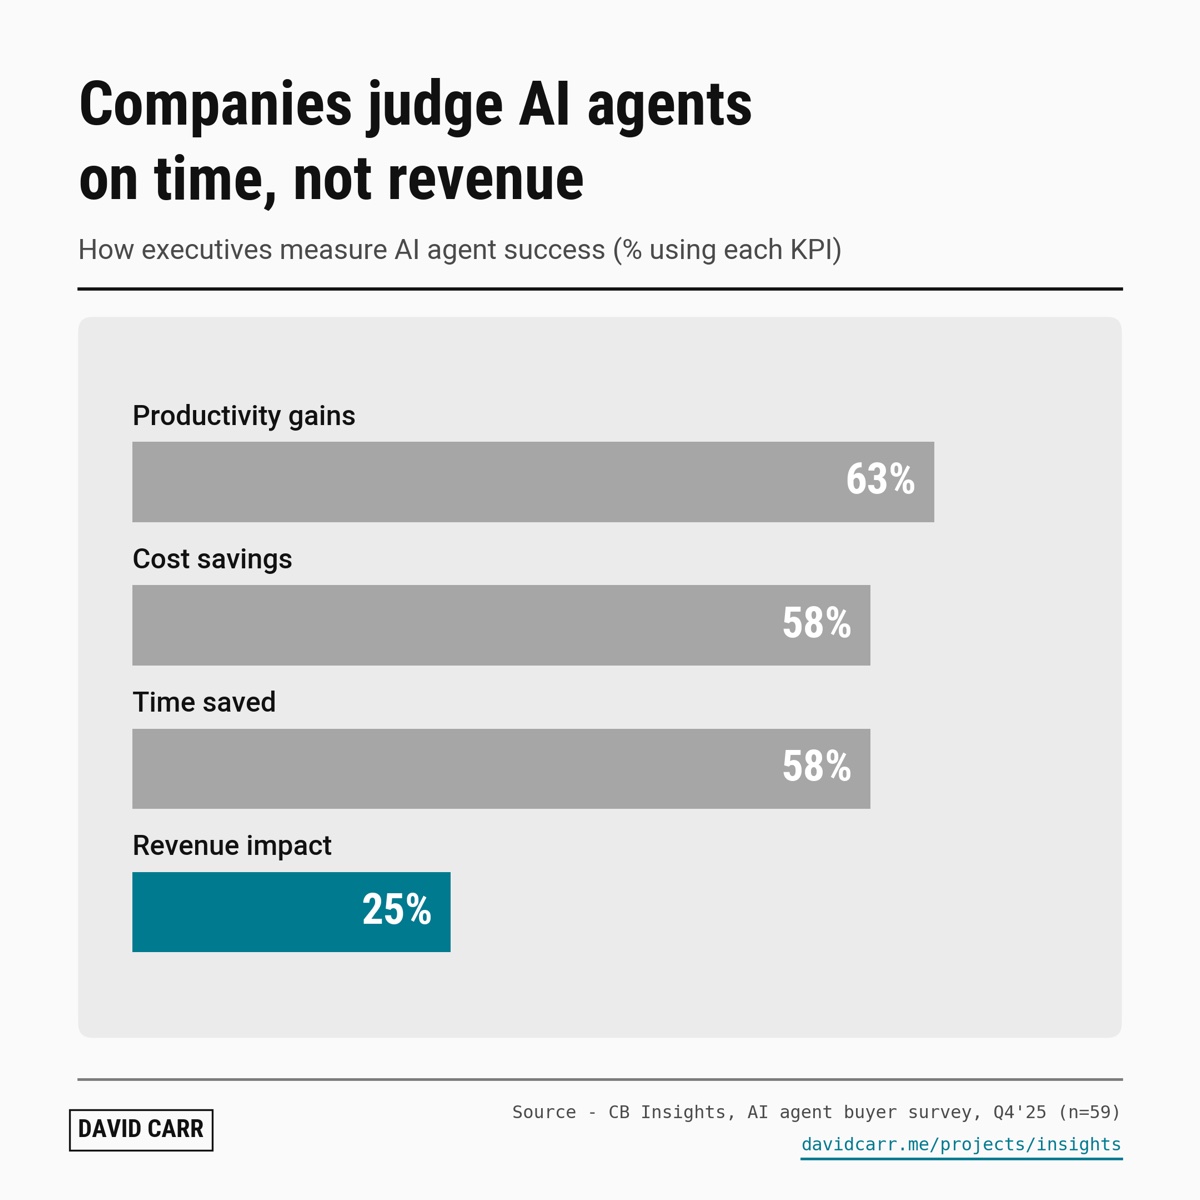 11 · Companies judge AI agents on time, not revenueOnly 25% measure revenue impact. Time saved is easy to claim and hard to put in a budget.
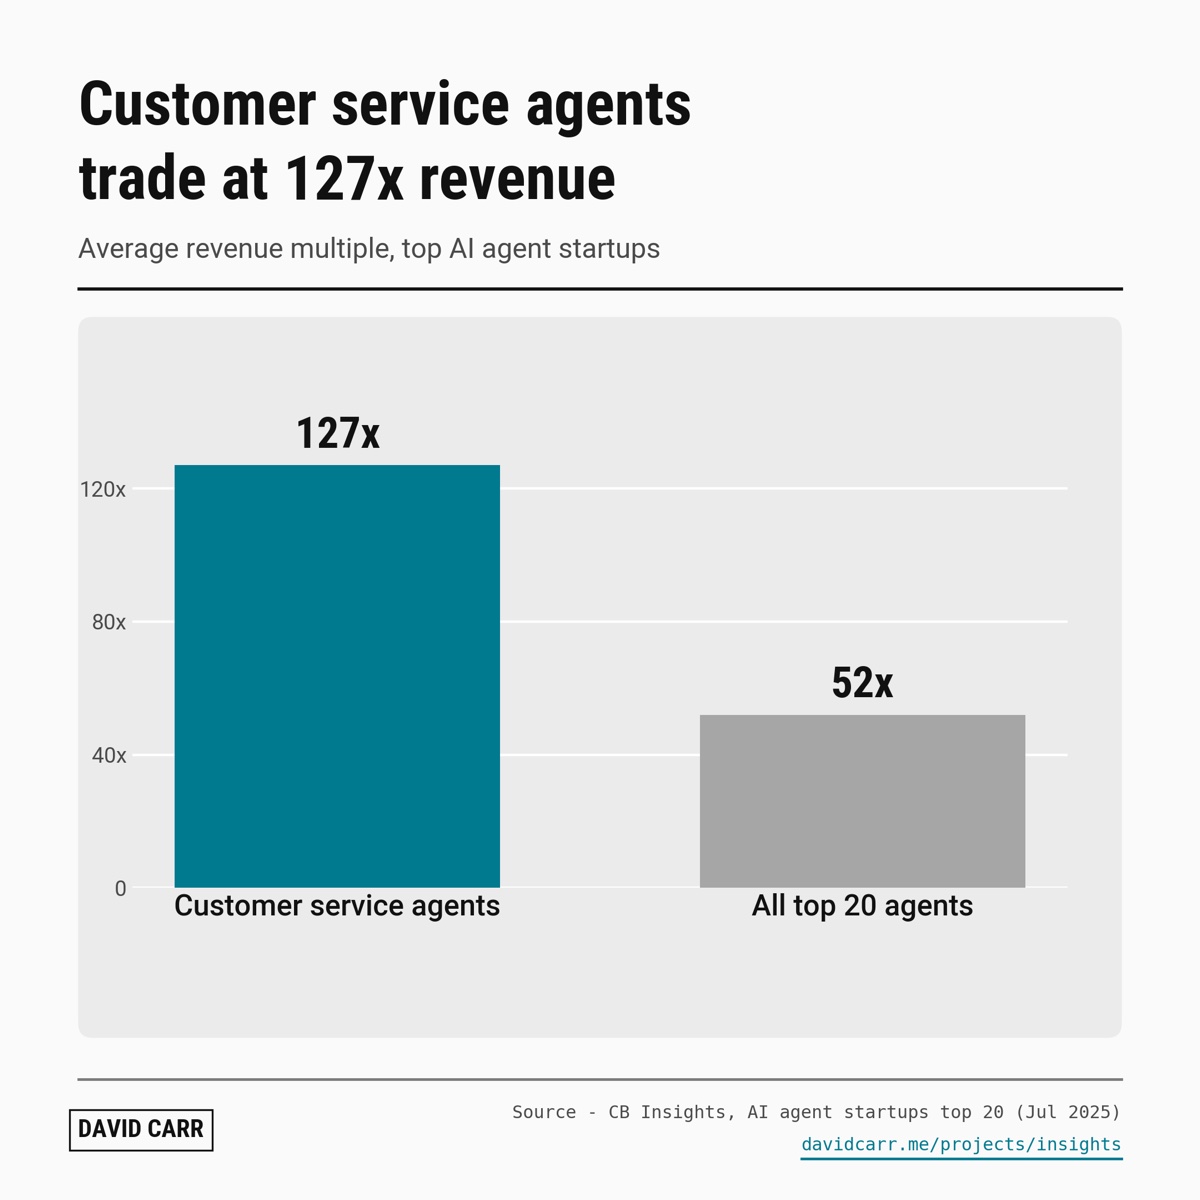 12 · Customer service agents trade at 127x revenueMore than double the top 20 average of 52x. Investors are pricing them as if they’ll replace whole support teams.
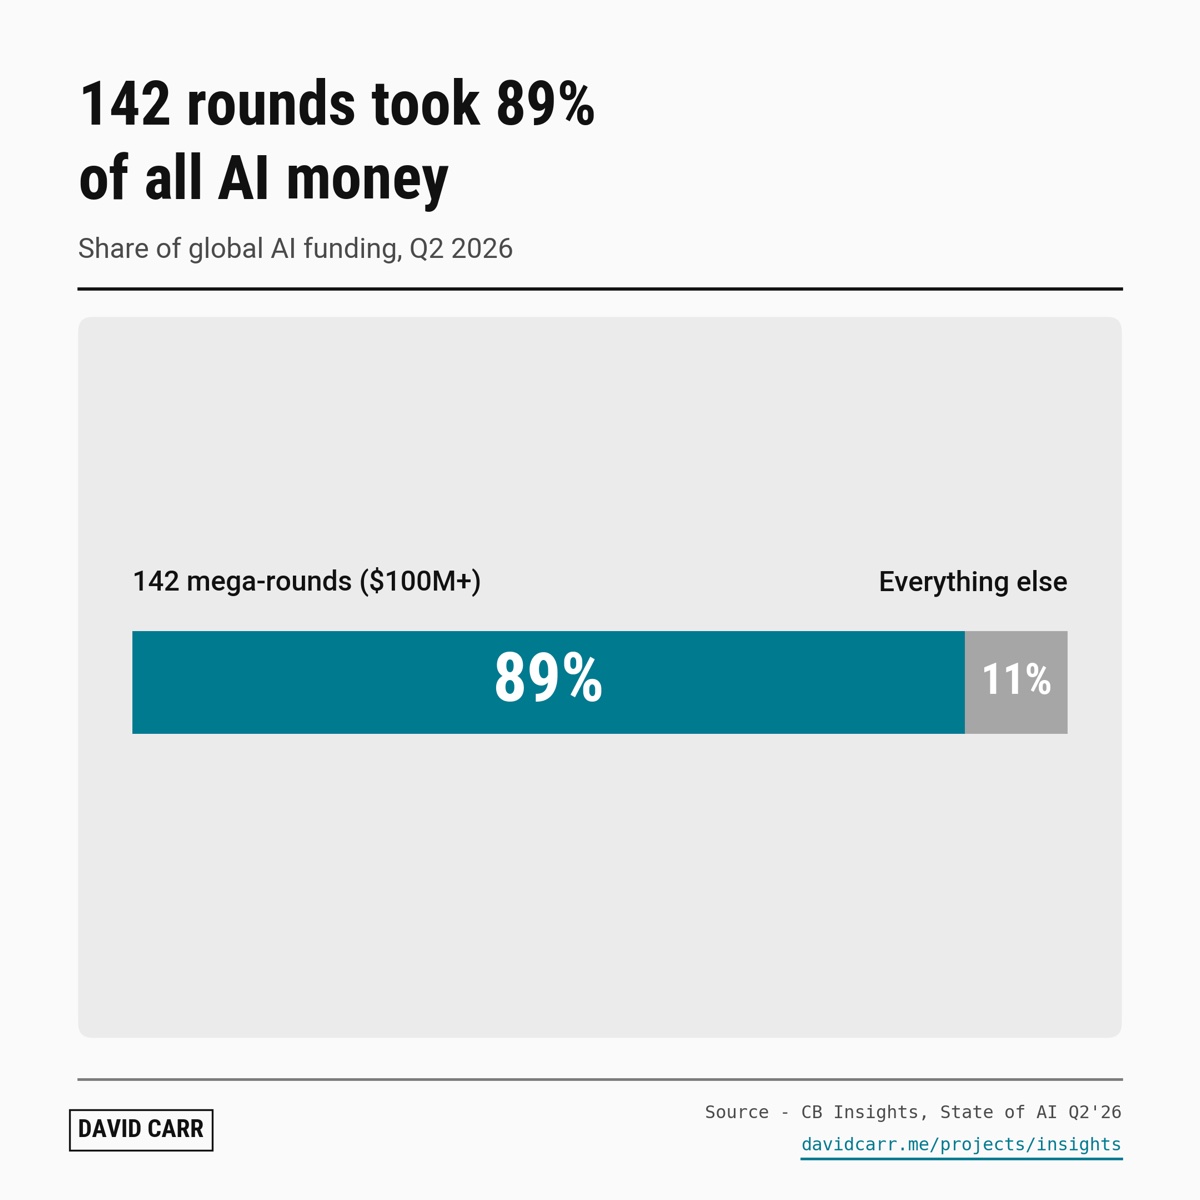 13 · 142 rounds took 89% of all AI moneyThe AI boom is real, but narrow. Most AI startups are raising in a much quieter market than the headlines suggest.
 14 · Class of 2021: where are they now? Sketch2021 was the peak year for funding. Five years on, how many of those companies are still standing?
 15 · Odds your startup gets acquired, by stage SketchEvery founder hopes for an exit. Few get one. What are the real odds at each stage?
 16 · Who’s still buying? Top acquirers, 2026 SketchM&A fell 22%. So who kept buying, and what did they buy?
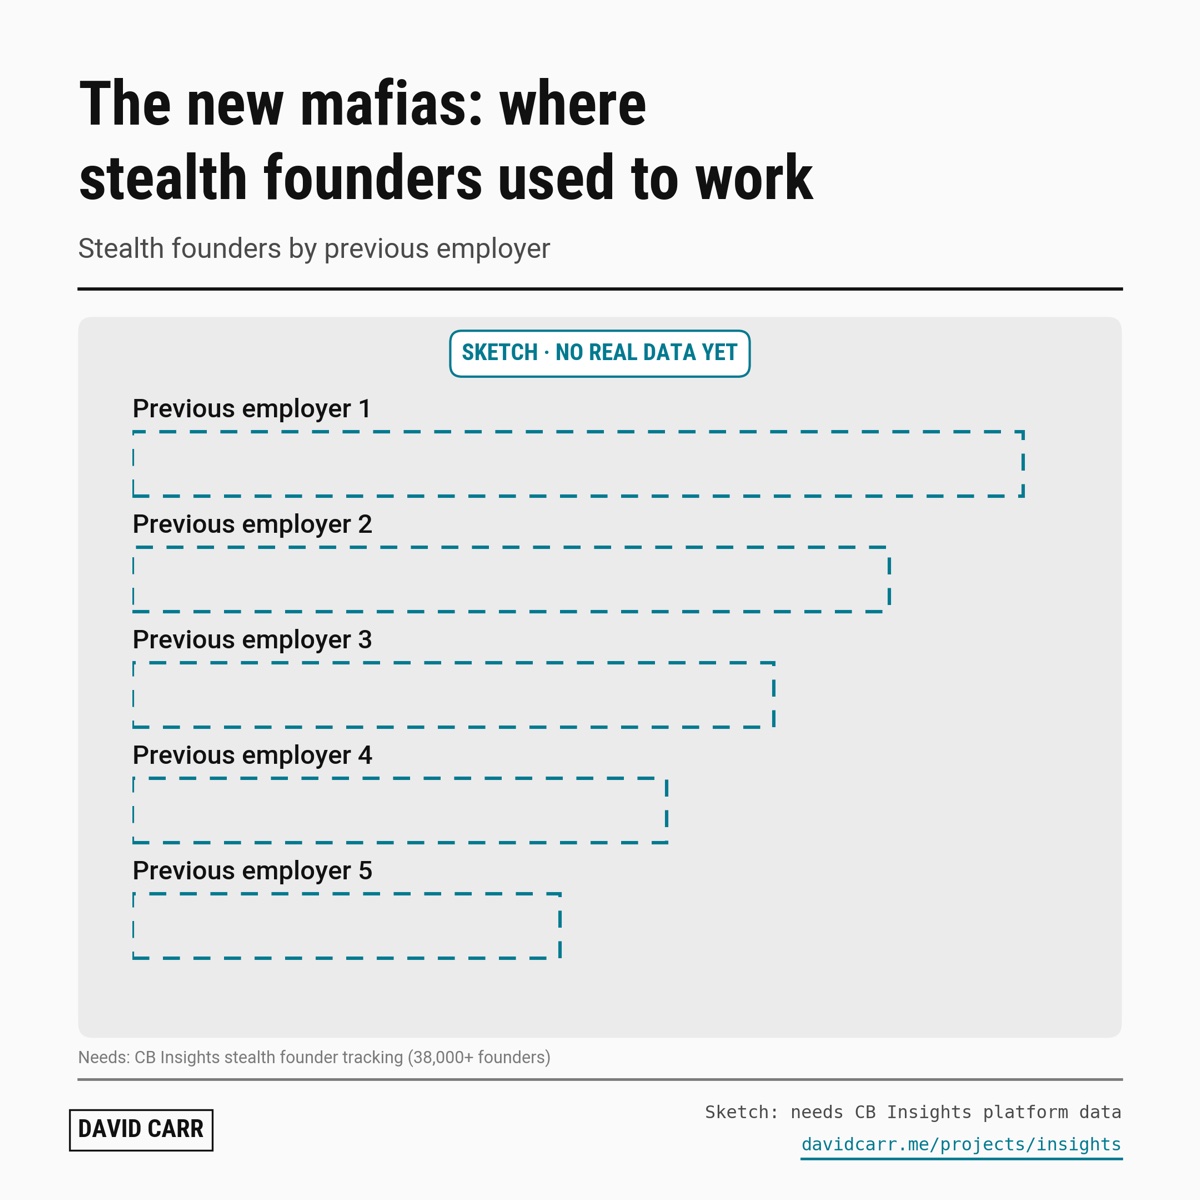 17 · Where stealth founders used to work SketchWhere founders used to work tells you where the next wave of startups is coming from.
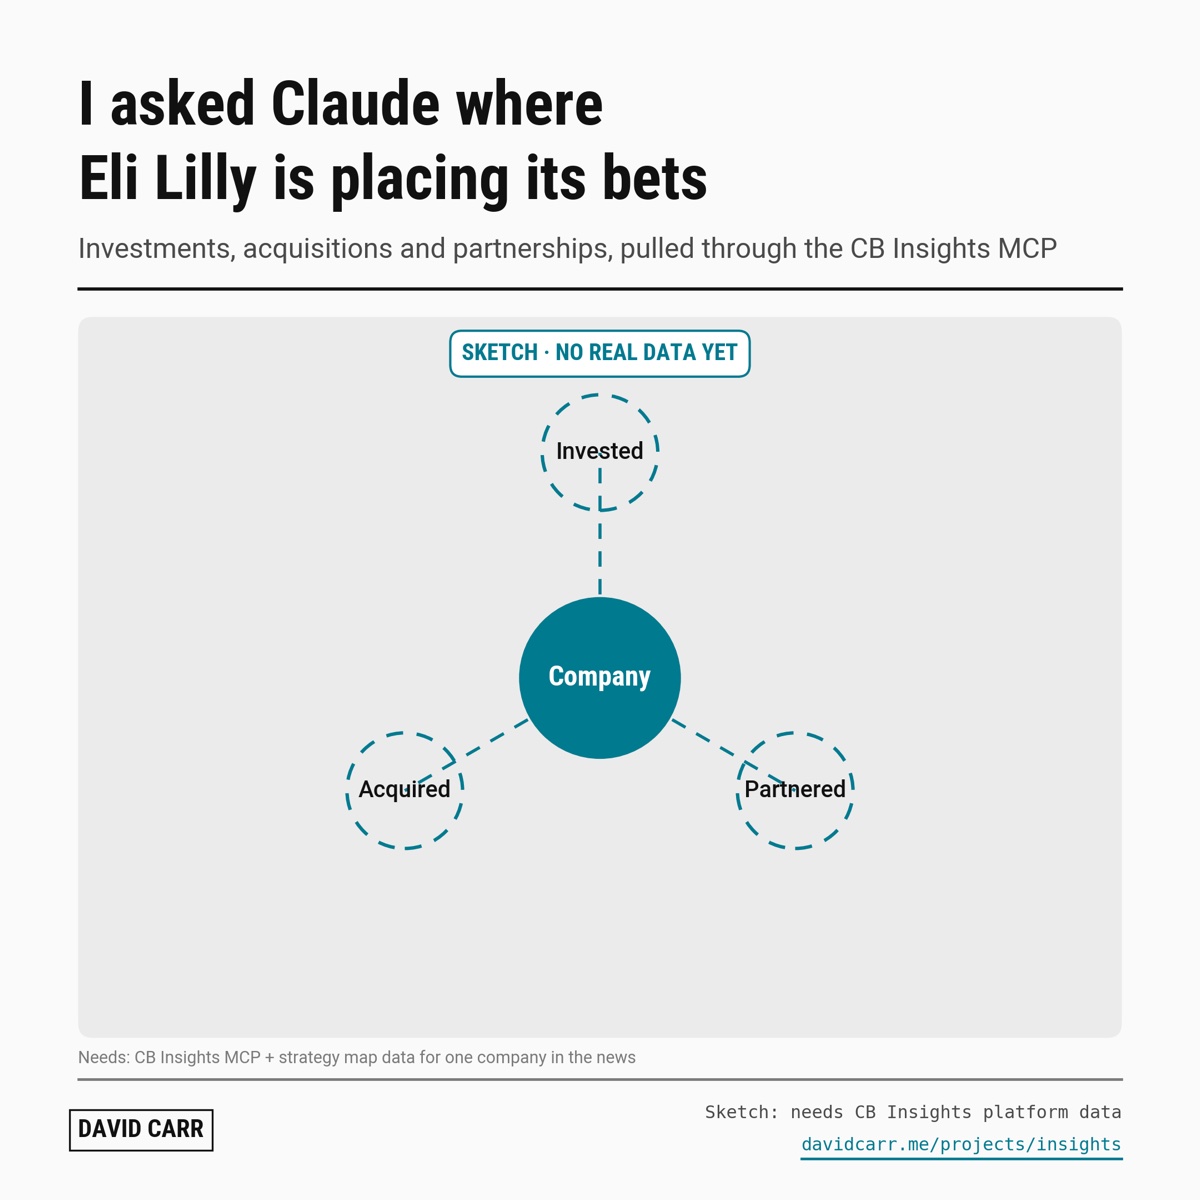 18 · Where is Eli Lilly placing its bets? SketchTheir best-performing format, the strategy map, built by asking Claude through the CB Insights MCP server.
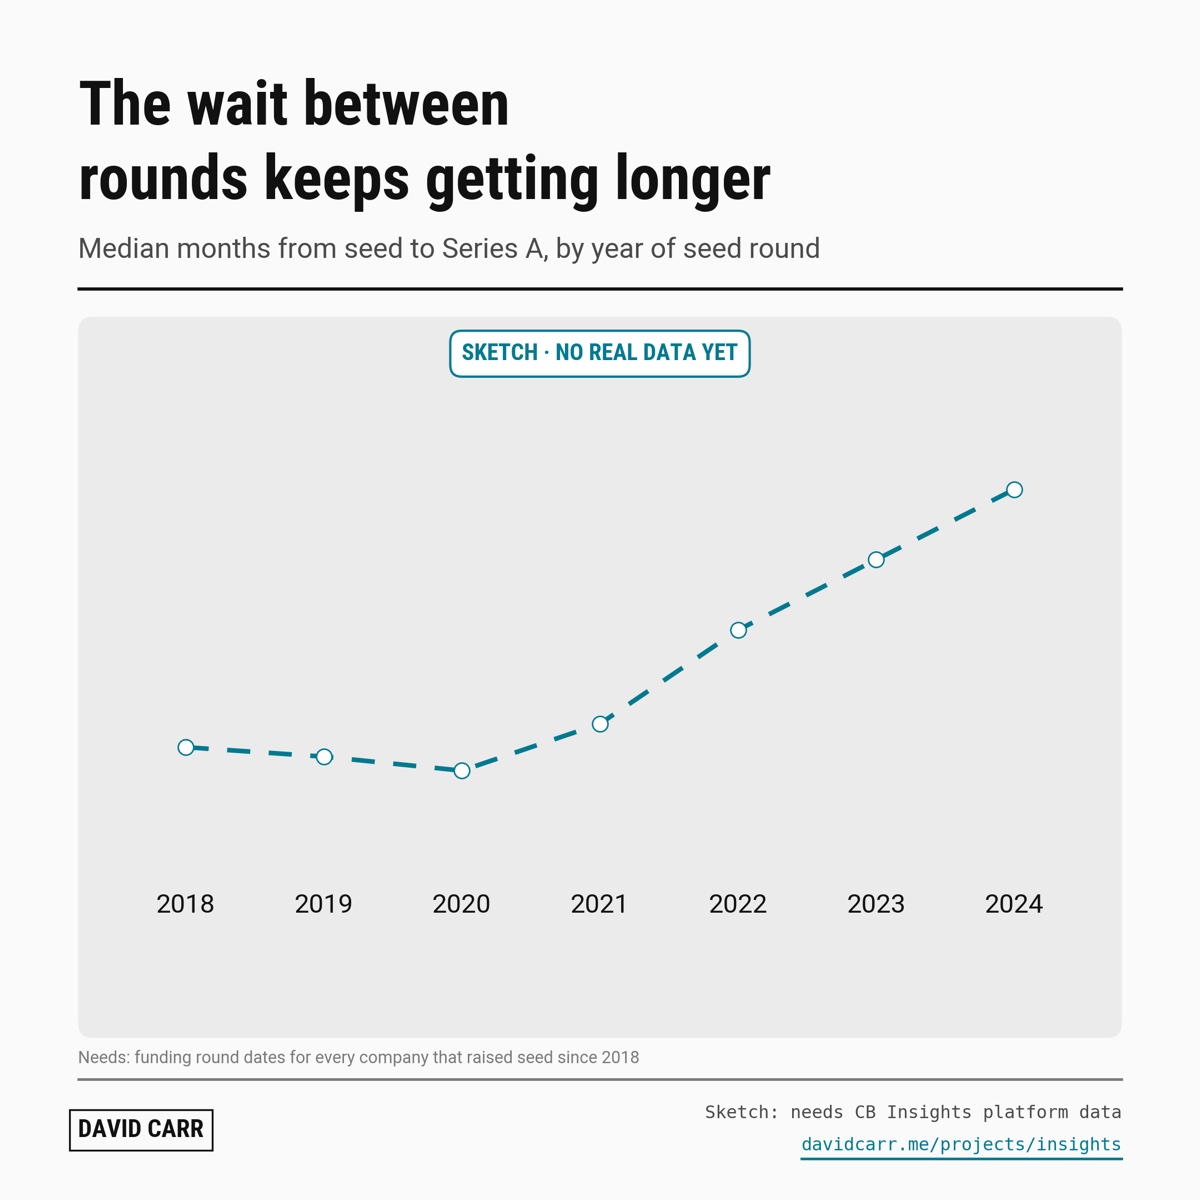 19 · The wait between rounds keeps getting longer SketchIf the gap keeps growing, the old advice of 18 months of runway is wrong.
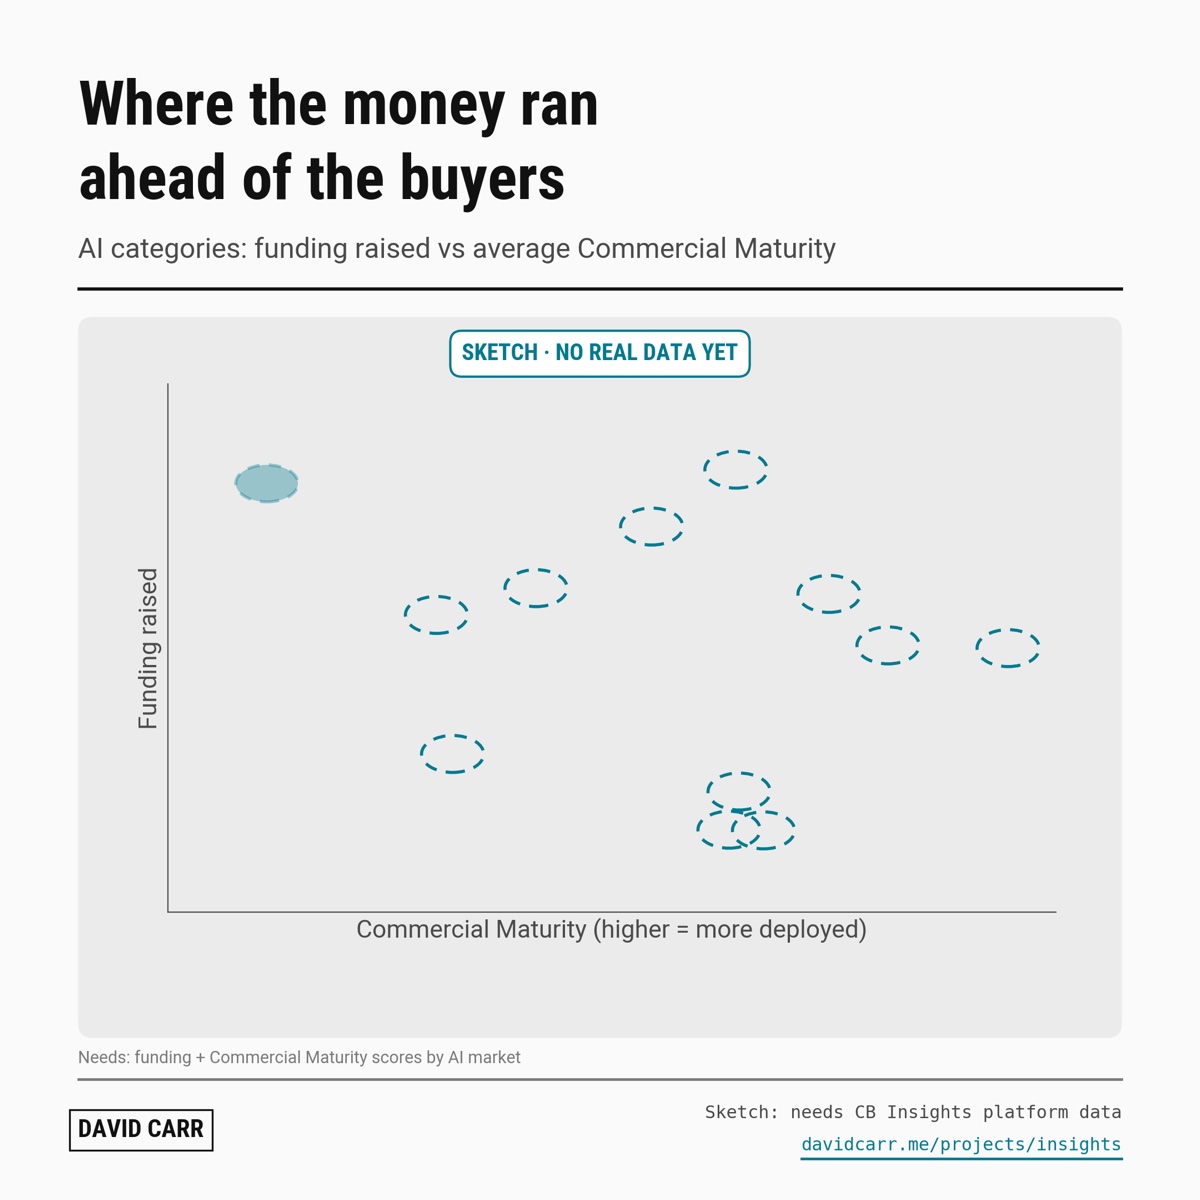 20 · Where the money ran ahead of the buyers SketchWhich AI markets have raised the most but are least used by customers? That’s where the hype is.
Four more, with more in each chart
Most of the charts above compare one thing with one other. Peter layers more into each chart, so I went back to the State of Venture Q3’26 numbers and sliced them four more ways. Wine is AI in every one.
More than bar charts
Peter doesn’t just use bars. Going by my tags on his 819 posts, about 147 break data down by stage, 111 show shares of a whole, 74 show distributions, 41 follow a cohort over time and 31 are bubble charts. I’m working through the same range.
| Chart type | When to use it | Mine so far |
|---|
| Bars, labelled | Comparing a few numbers | 01 to 05, 10 to 12 |
| Stacked bars over time | A whole and its parts, quarter by quarter | 21 |
| Small multiples | The same chart side by side, one panel each | 22 |
| Dot grids | Making a ratio feel real, like 17 to 1 | 24 |
| Indexed lines | Two things that move apart over time | 06, and 08 as indexed bars |
| Stacked shares | One slice against the whole | 09, 13, 23, sketch 14 |
| Bubbles | Three numbers at once, like money, deals and round size | 07, sketch 20 |
| Cohort heatmaps | How a group of companies does over the years | Not yet. Needs platform data |
| Percentile bands | The spread, not just the median | Not yet |
| Benchmark tables | Medians by stage that people save and share | Not yet |
Checked against Peter’s rules
Where I’m following them, and where I’m not yet.
| Rule | How I did |
|---|
| One chart, one idea | All twenty. |
| His post structure | All five posts: claim, chart below, numbers, what this means, caveats, close. |
| Caveats up front | In every post, and the sample is in each chart’s subtitle where I have it (chart 1: 23,458 deals). |
| One frame, annotated | Every chart shares one frame: key words boxed in their series colour so there’s no legend, sample in the subtitle, source and link in the footer. Callouts and brackets point at the one thing to see. |
| Facts vs guesses | Guesses are marked. Chart 4 says which number I worked out. |
| Axes | Chart 06 is a line over time and 07 is a bubble chart, so both have light axes. The bar charts have a value on every bar instead. |
| Cohorts beat snapshots | Weakest area. Only chart 2 is a cohort, and it’s from 2008 to 2010. A fresh one needs platform data. |
| Fresh data | Charts 2 and 5 use older public reports. Both need a refresh. |
| Primary sources | Ten charts lean on news summaries of gated reports, mostly one summary of the Q3’26 report. I cross-checked where I could: BeBeez’s quarterly deal counts add up to exactly CB Insights’ own 2026 figure. |
Every number and its source
Each chart has a CSV: label, value, unit, source, link, and whether the source is primary (CB Insights published it) or secondary (a news site summarised one of their gated reports). The full list is in SOURCES.md.
Feedback, please
I’m practising, so I’d love to hear what you’d change. Especially from Peter Walker, whose rules this page is built on, and from Karl Kong and the team at CB Insights, whose data it uses. What would you cut? Which one would you actually post?
Message me on LinkedIn.
My own practice work. Not made with, or for, CB Insights or Carta. All figures are from their public pages, linked above.
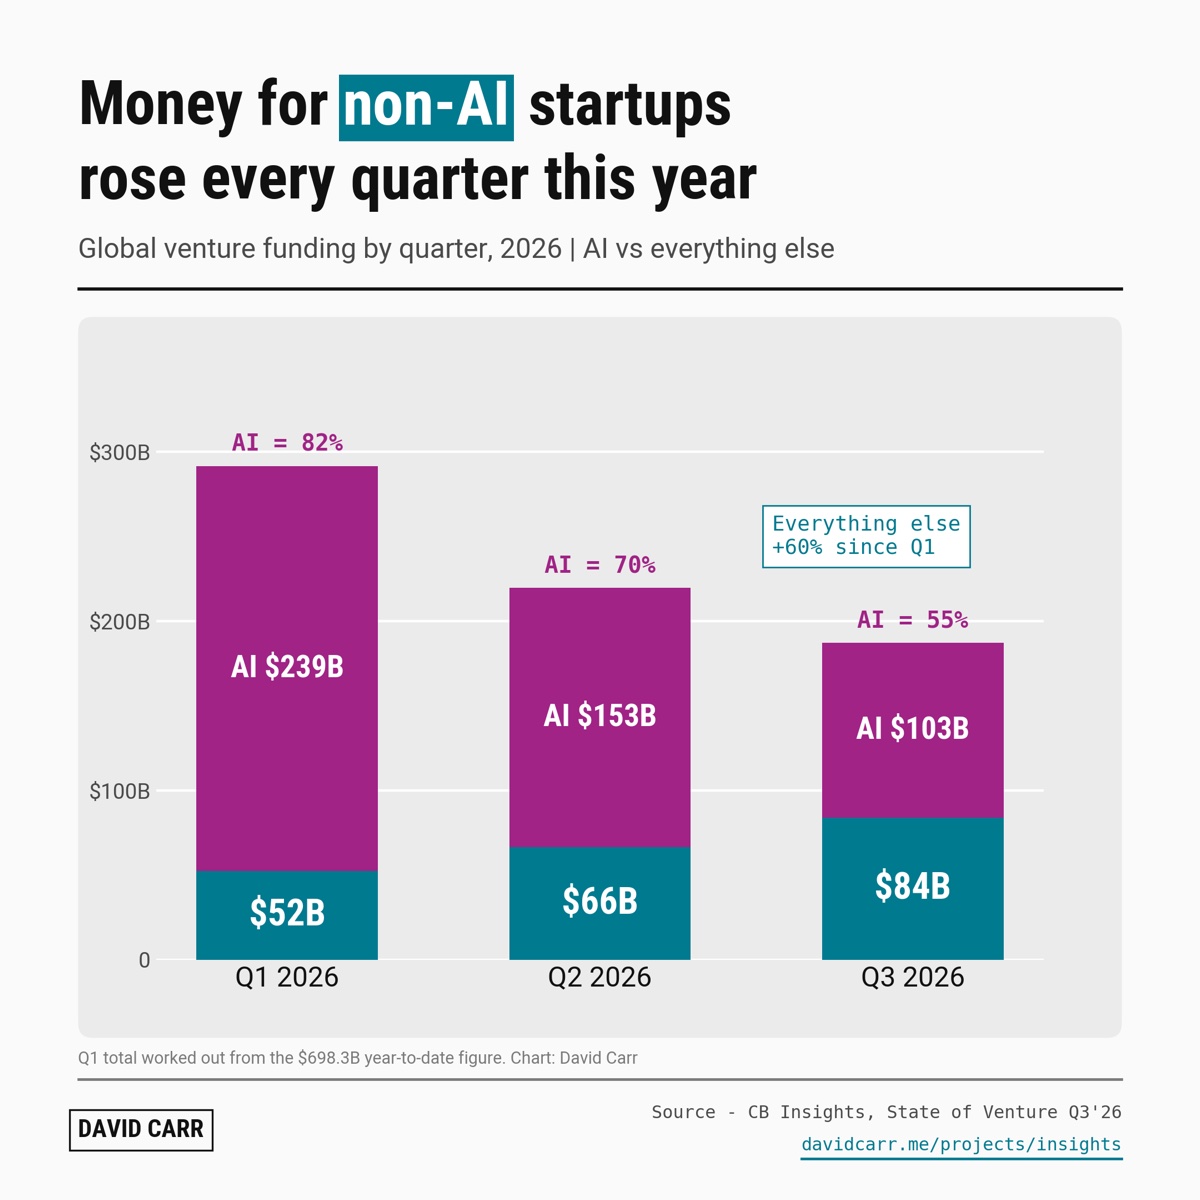 21 · Money for non-AI startups rose every quarter this year
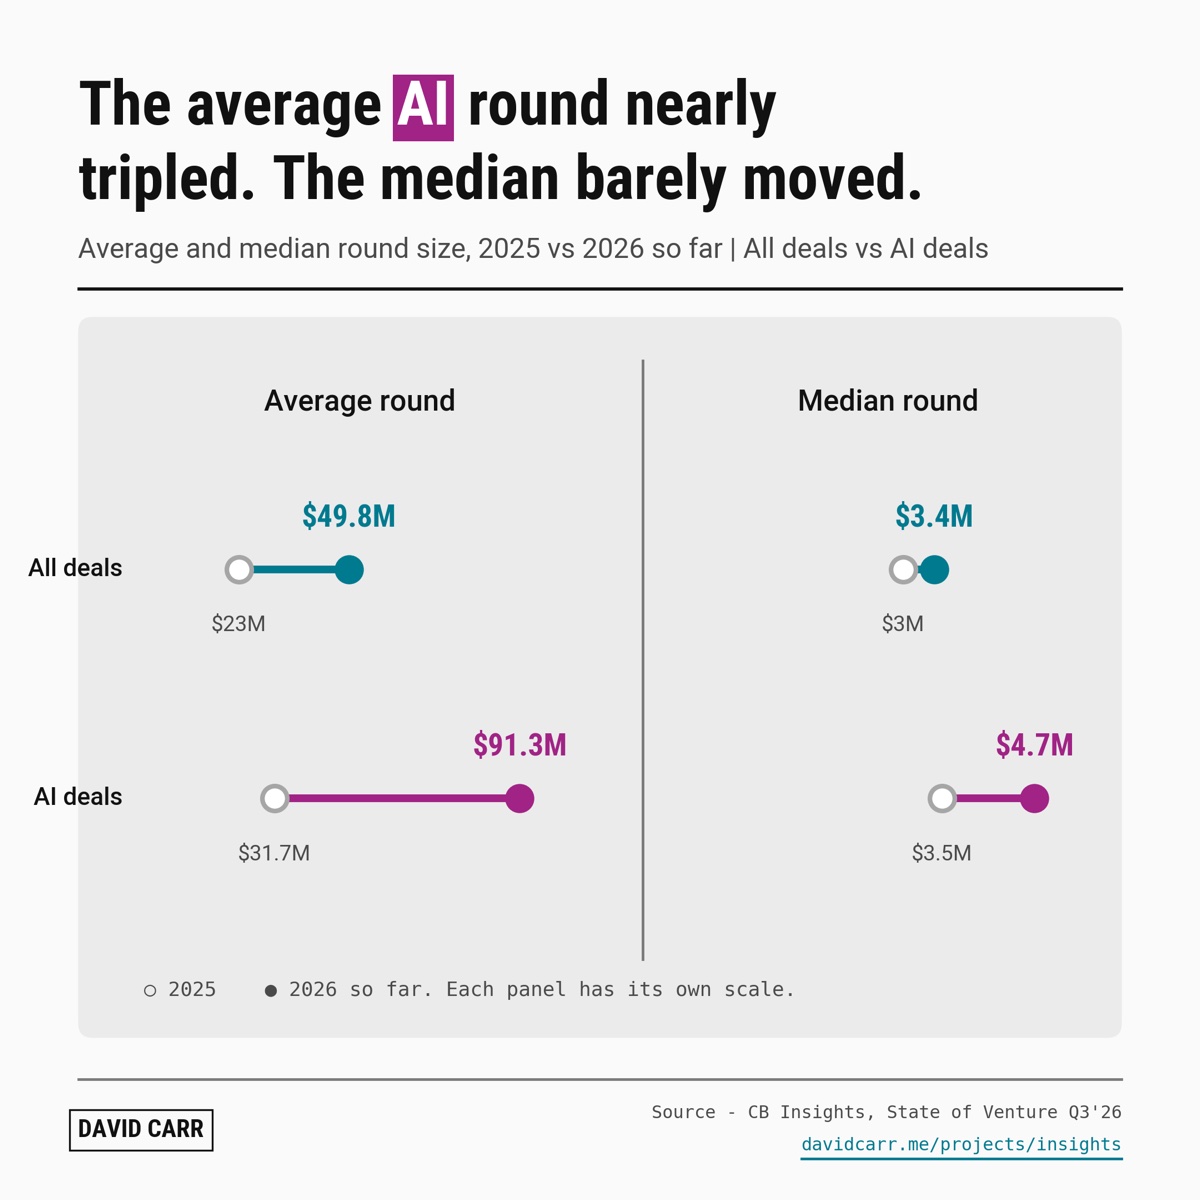 22 · The average AI round nearly tripled. The median barely moved.
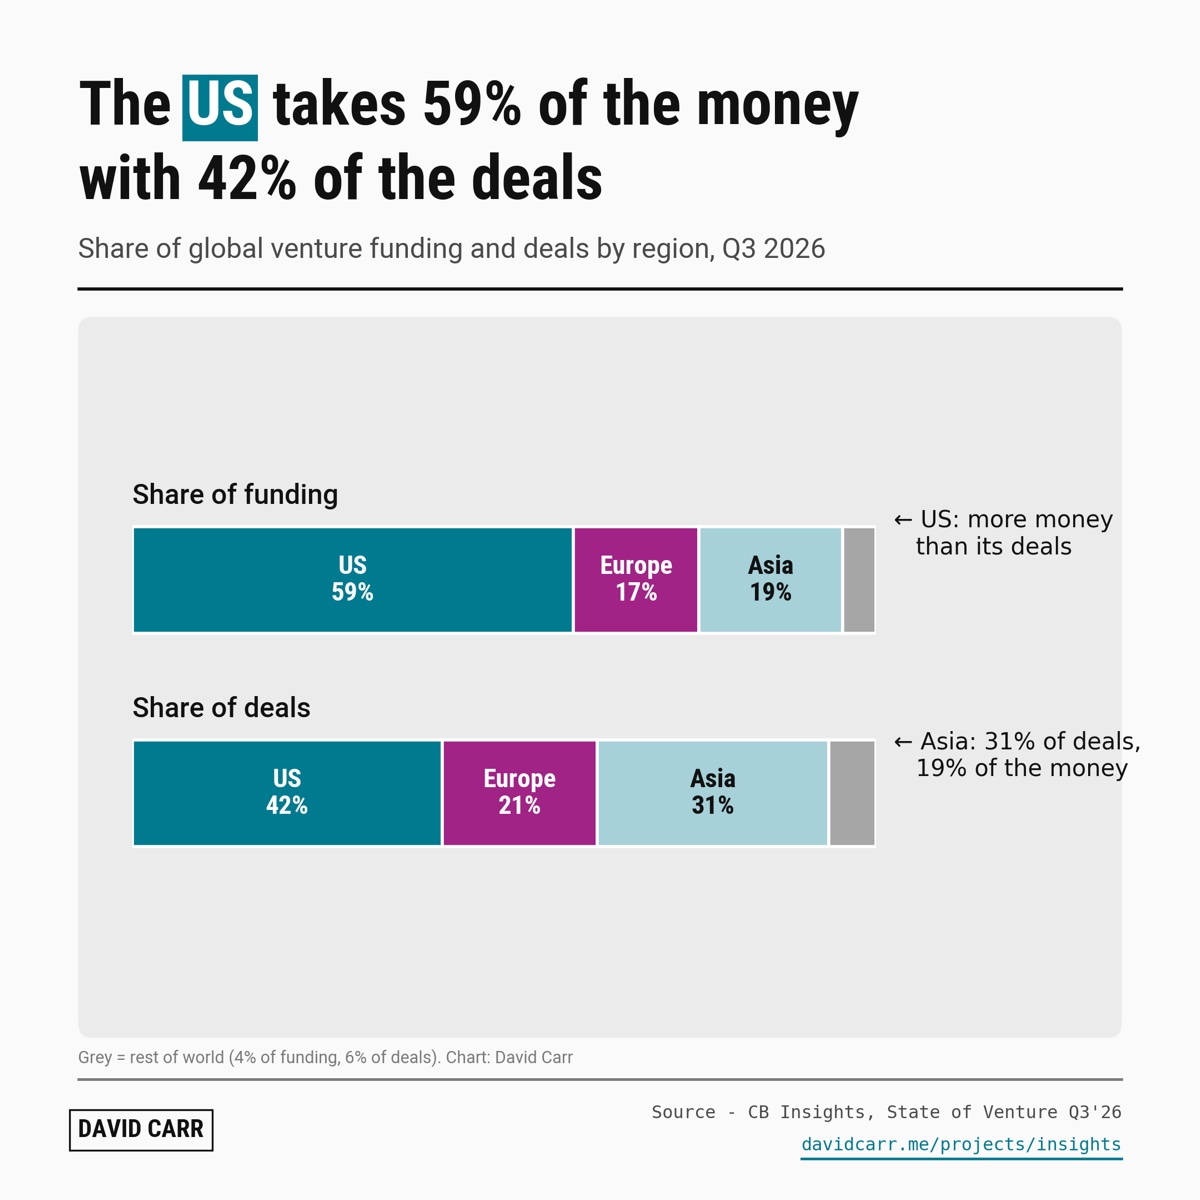 23 · The US takes 59% of the money with 42% of the deals
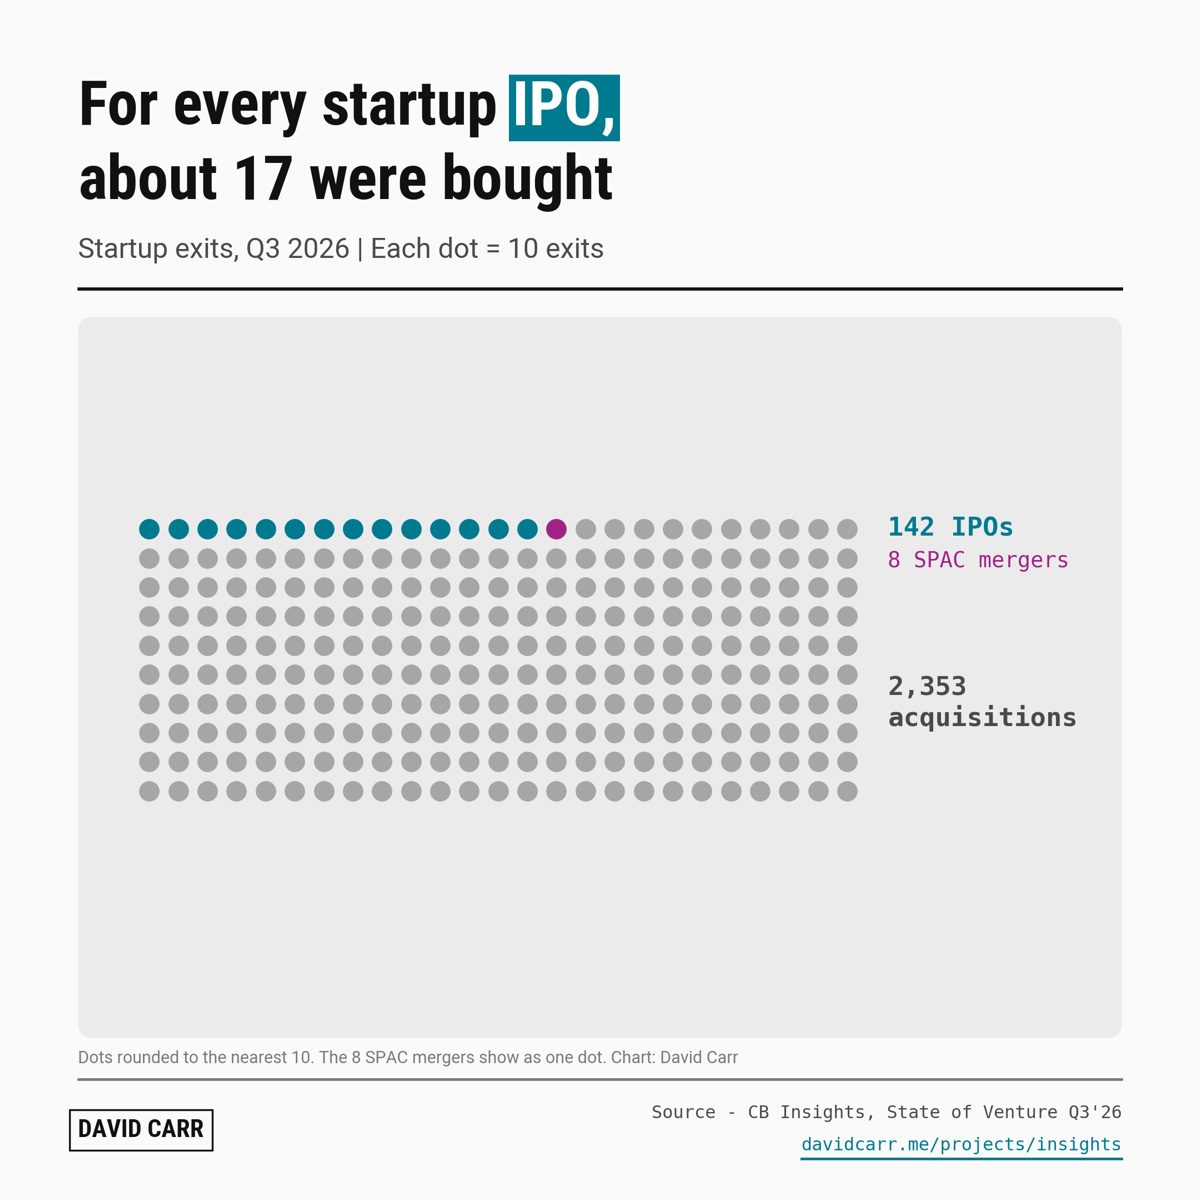 24 · For every startup IPO, about 17 were bought