Practice
My Peter Walker notes
Everything I saved while studying how Peter Walker writes data posts: how my notes are set up, every rule I took from him, and the charts I learned the most from.
How my notes are set up
Plain Markdown in a private folder I call David-OS, so I can reuse it and so can Claude. I saved all 819 of Peter’s Carta posts and every chart, tagged each post for its hook, structure, caveats, ending and key number, then wrote the patterns down in my own words.
david-os/
├── brain/                                  my notes on how the best writers work
│   ├── peter_walker_insights_playbook.md   12 rules, hook bank, formats, his best 27 posts
│   ├── chart-style-carta.md                his frame, annotations, colours, checklist
│   ├── chart-types.md                      every chart type, by the question it answers
│   ├── topics/          29 files           writing craft, data, growth, career...
│   └── sources/         60 files           one per newsletter I study
├── archive/
│   ├── peter-walker/
│   │   ├── peter_walker_posts_annotated.json   819 posts, each tagged
│   │   └── charts/      001.jpg ... 819.jpg    every chart, saved to study
│   └── cb-insights-linkedin/                 138 posts, audited
└── work/cb-insights-pitch/                   one folder per step, 01 to 09
His 12 rules
What all 819 posts have in common. From peter_walker_insights_playbook.md.
- One chart, one idea. Each post makes a single point about a single graphic.
- Name the reader in line one. “Founders -” tells them in one word it’s for them.
- The number is the hook. The stat alone can be the first line.
- Ask, then answer on line two. Suspense, resolved straight away.
- Bust a myth people repeat. Replace folklore with a base rate.
- Give the reader ammunition. A chart they can use to win an argument or a negotiation.
- Show the gap between two lines. Two things pulling apart explain why a market feels the way it does.
- Cohorts beat snapshots. Follow a group over time and report what happened to it.
- Caveats up front, in plain English. Sample size, definitions, what the data can’t show.
- Separate facts from guesses. Say which is which, and admit when you were wrong.
- Have a take. End on one line you believe.
- Recycle winners. Repost the best charts with fresher data or a sharper hook.
How he writes a post
About 4.5 posts a week, around 240 words, one chart. From my tags on all 819.
- Line one: the claim, often with the number in it.
- The setup: one or two lines, then “chart below shows”.
- The numbers: one per line.
- What this means: two or three short points.
- Caveats: sample, period, limits.
- The close: a question he answers himself, or one blunt line.
How he frames a chart
The same frame every time, so people know it’s his before they read a word. From chart-style-carta.md.
- Headline: a claim, not a label. Big, bold, one or two lines.
- Key in the header: series named on colour blocks, or the key words coloured in the headline. No legend box.
- Subtitle with the sample: “Data: 9,334 US startups ... | 2023 to 2025 | US only”.
- A rule under the header, then a one-line caption saying what’s plotted.
- No panel: the chart sits straight on the page, light gridlines, values on the marks.
- Footer: a rule, the logo, and the link written out, because images aren’t clickable.
How he annotates
- A plain sentence floating in empty space.
- Two dots joined by a line, with the change: “Up 47% from week of June 8”.
- A bracket across bars with the multiple in the gap: “14.7x YoY”.
- Boxed labels inside the chart: “Anthropic | Most recent week: 48%”.
- A dashed reference line with its value: the median, or 50%.
- A highlight box round the column or group that matters.
- Arrows to side notes in plain English.
- The last value labelled in the series colour.
- The encoding explained once on the chart: “75th percentile” with an arrow.
The checklist I run before posting
- Claim headline, with a key in colour instead of a legend.
- Subtitle says the sample.
- More than one number against one.
- The right chart for the question (see Choosing a chart).
- One call-out pointing at the thing to see.
- Footer with the source and the link.
- Post in his structure, with caveats up front.
Twelve of his charts I learned the most from
A few of the 819 I saved, each showing a different way to display data. They’re Peter’s, made for Carta, shown small with credit. All are public in Carta’s archive.
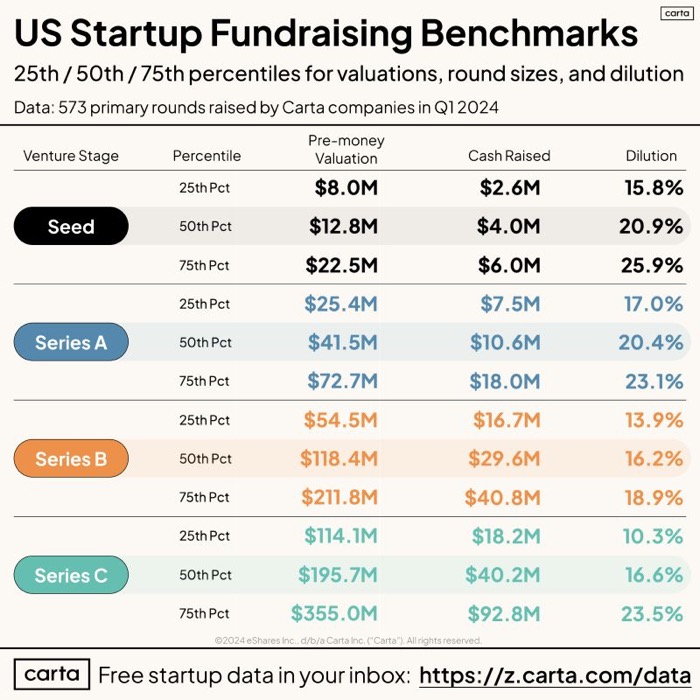
Peter Walker, Carta: “Q1 2024 startup valuation and round benchmarks”
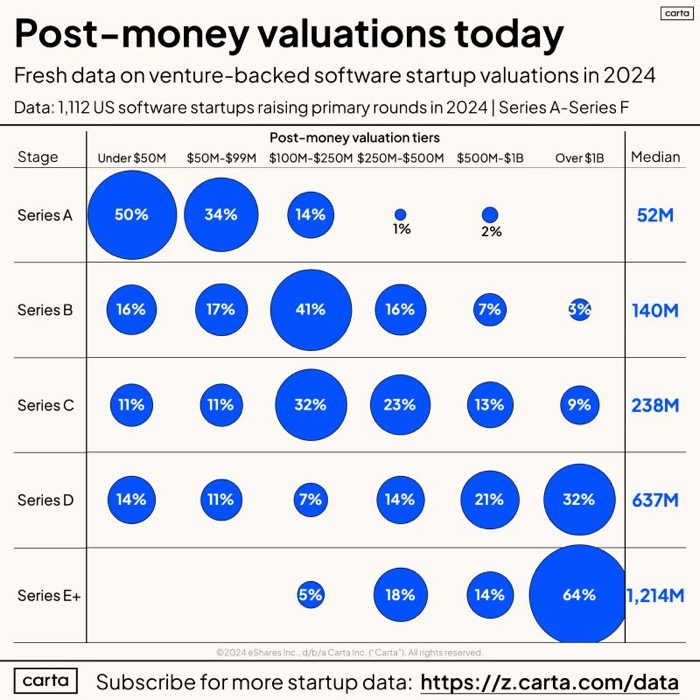
Peter Walker, Carta: “How software startups are valued across rounds”
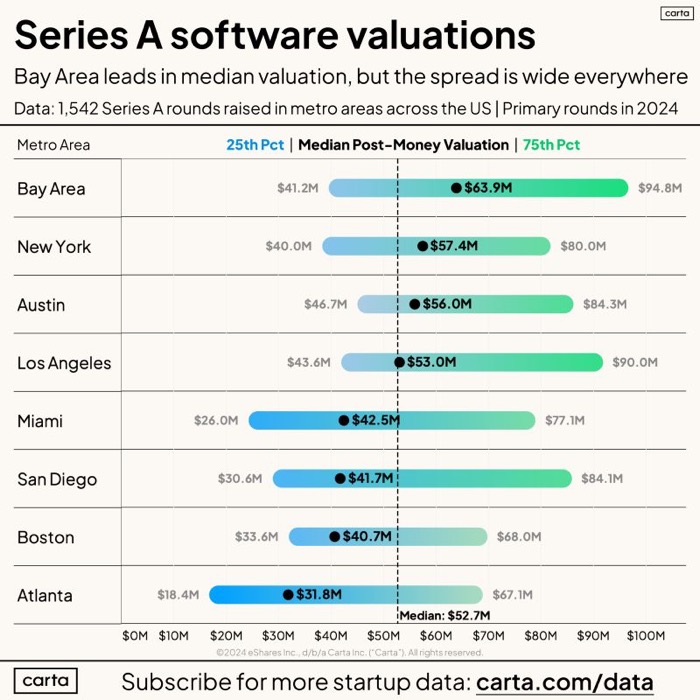
Peter Walker, Carta: “Series A valuations by US city”
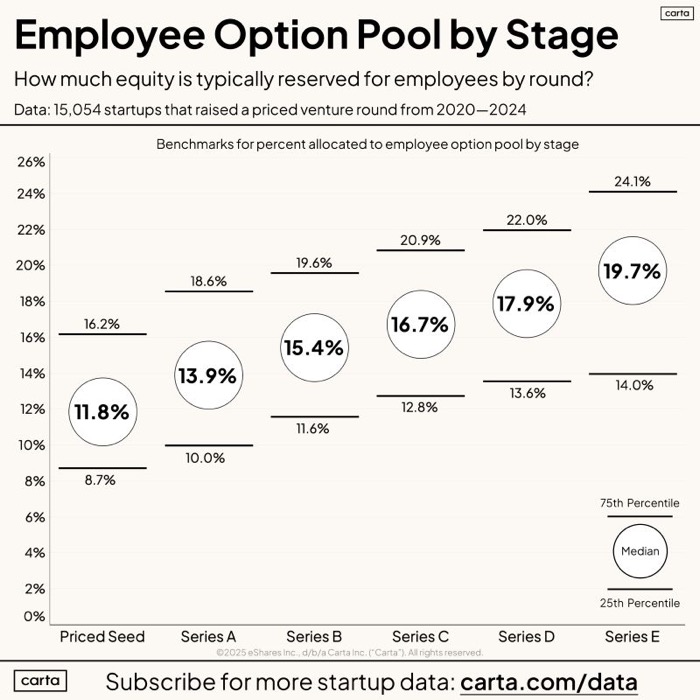
Peter Walker, Carta: “Push back on a 20% option pool”
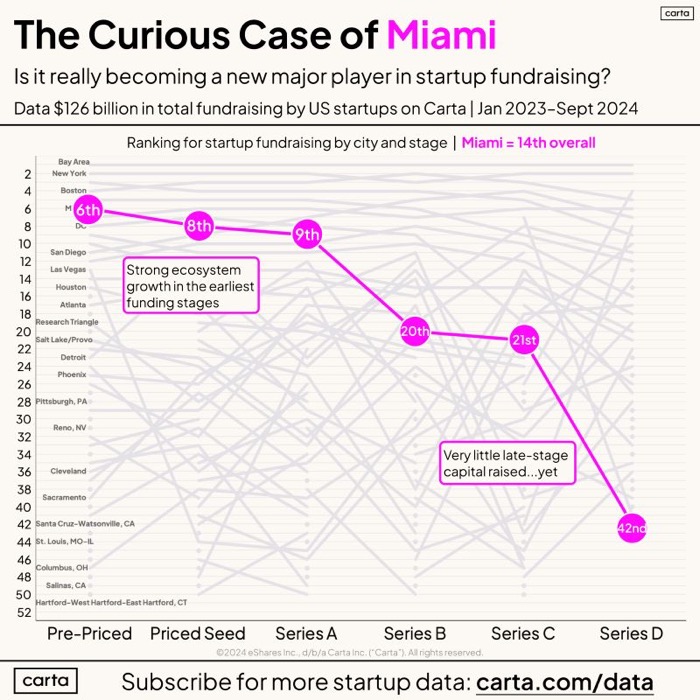
Peter Walker, Carta: “Miami is a rising early-stage hub”
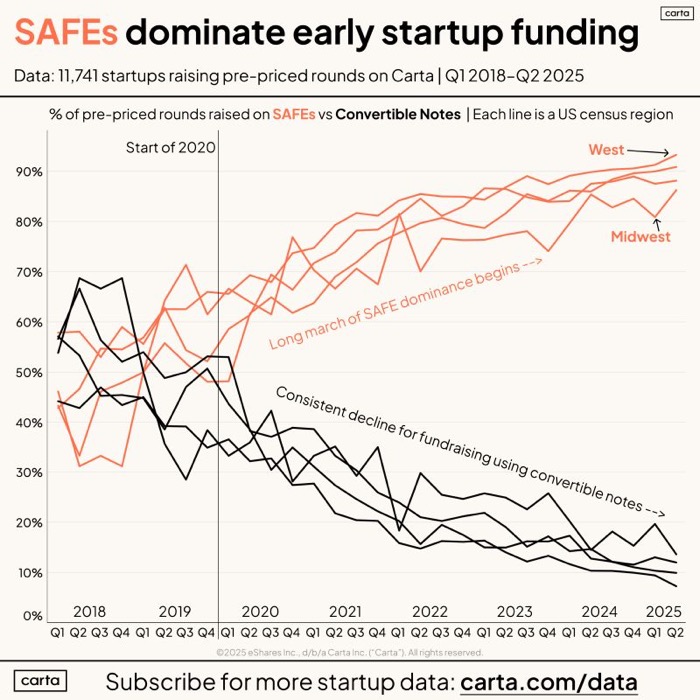
Peter Walker, Carta: “SAFEs have won the early funding war”
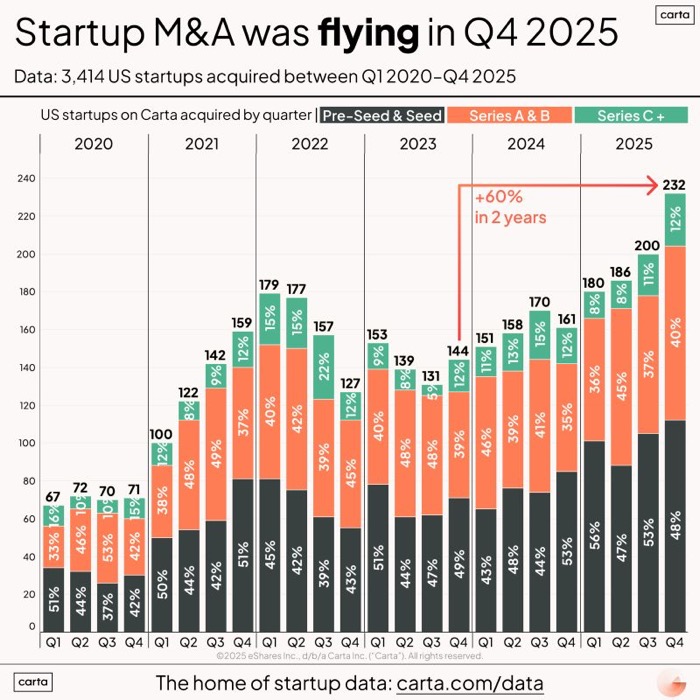
Peter Walker, Carta: “Q4 2025 was the hottest startup M&A quarter ever”
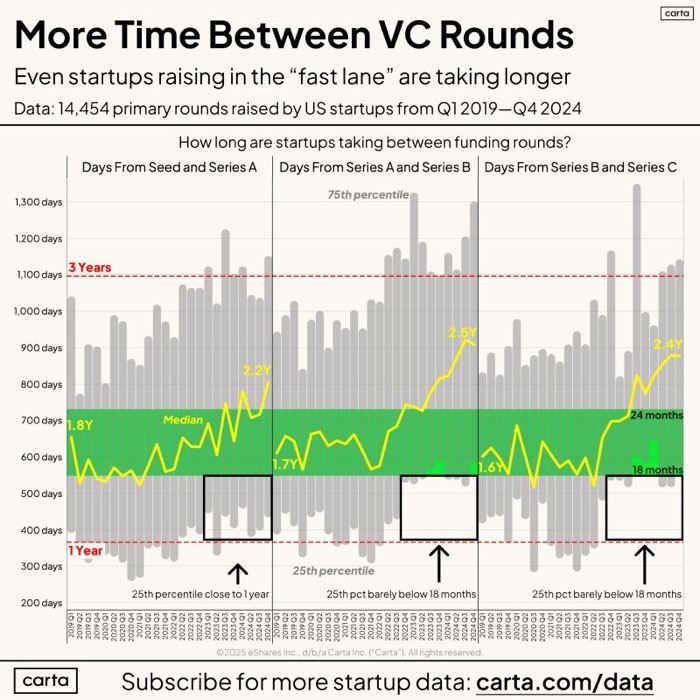
Peter Walker, Carta: “Raising every 18 months is now a plan to fail”
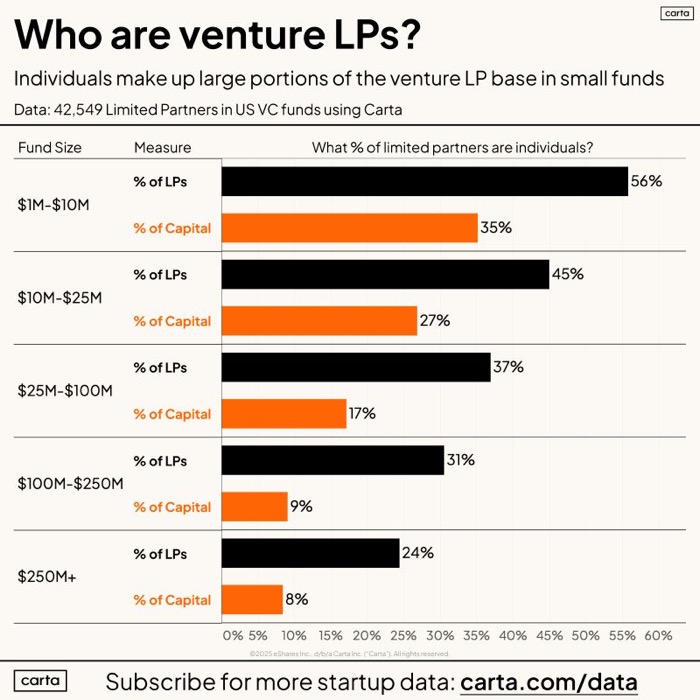
Peter Walker, Carta: “More than 40% of small-fund LPs are individuals”
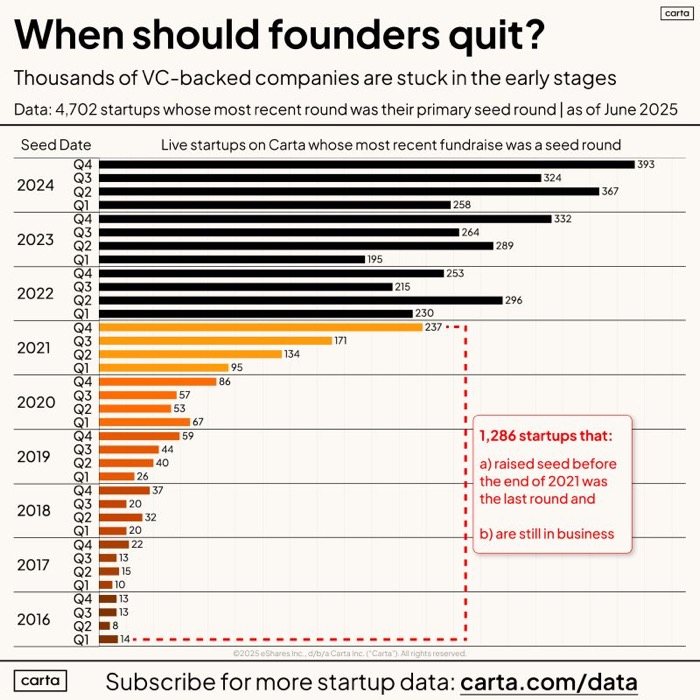
Peter Walker, Carta: “Never quit, or fail fast?”
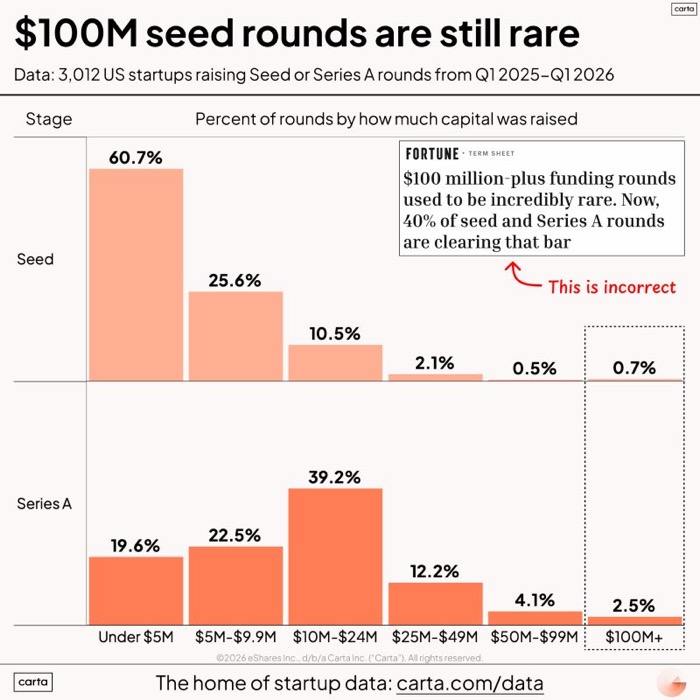
Peter Walker, Carta: “Fortune got it wrong: $100M seeds aren't normal”
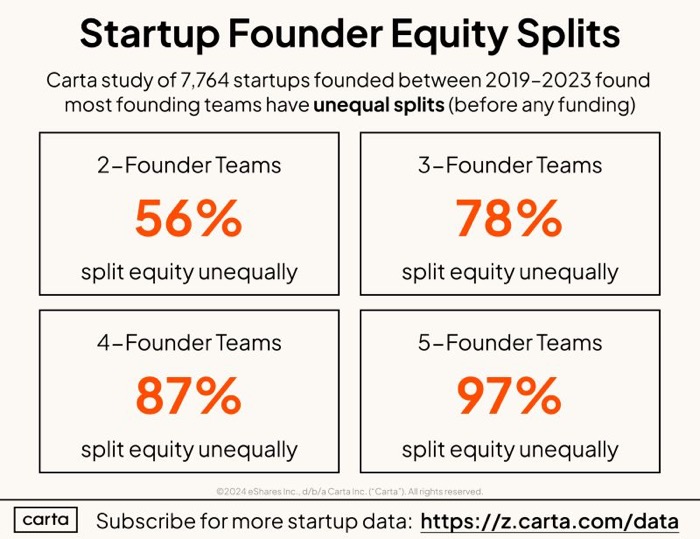
Peter Walker, Carta: “Founder equity splits by team size”