6Match their lookTeal and wine, from their own charts
7Build the charts4 rounds, 3 versions each
8Write the posts17 posts and drafts
9Ask for feedbackThis page
Who CB Insights is for
I started with the reader, not the data. CB Insights sells to four groups. Each pays for data the others don’t need, and each has a question they keep asking. I wrote the question down first, then went looking for a CB Insights number that answered it.
Investors
“What are the odds, and is the market turning?”
VCs and LPs. They pay for funding rounds, valuations and exits, and they want base rates to argue with.
CHARTS 01 · 02 · 04 · 06 · 07 · 09 · 11 · 14 · 16
Corporate development and M&A
“Who is buying, what does it cost, and how early?”
The people who buy startups. They pay for M&A data, acquirer lists and revenue multiples.
CHARTS 08 · 12 · 13 · and startup exits, below
Corporate strategy
“Where is everyone else placing their bets?”
Strategy and innovation teams at big companies. They pay for business relationships, strategy maps and market maps.
CHARTS 03 · 04 · 08 · 10 · 15
Enterprise tech buyers
“Is AI paying off, and which vendors will last?”
The people picking AI vendors. They pay for buyer surveys, Commercial Maturity scores and vendor profiles.
CHARTS 05 · 17
Four rounds of design
Each round fixed what the last one got wrong.
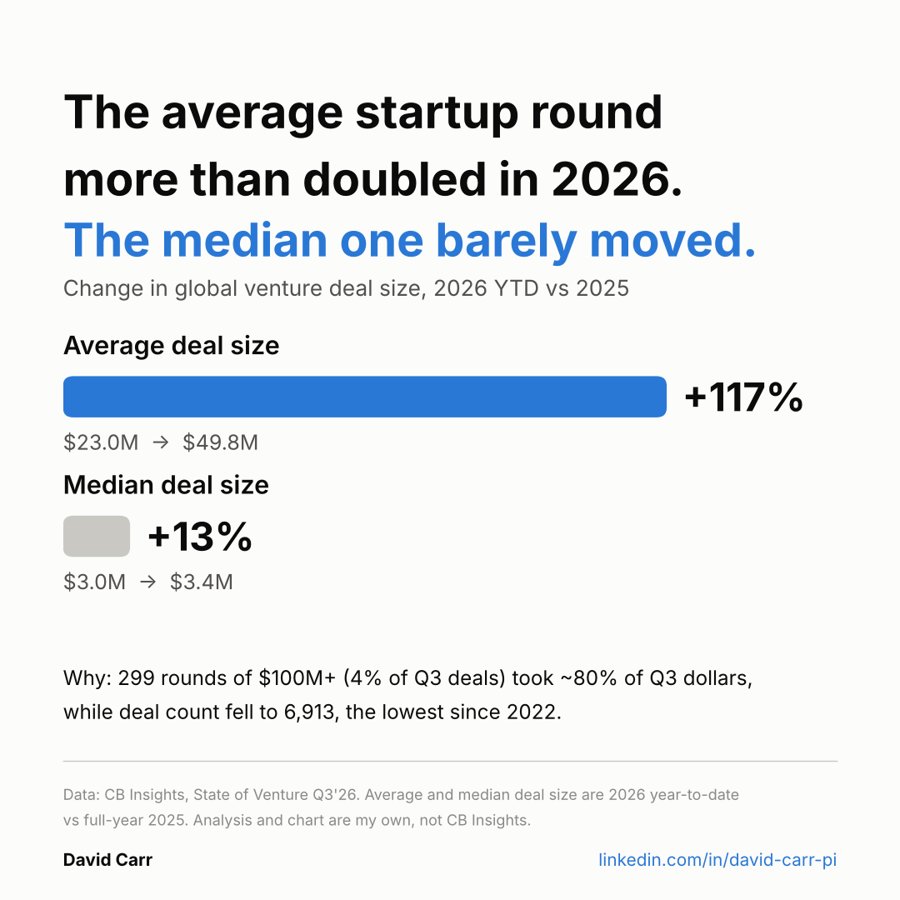
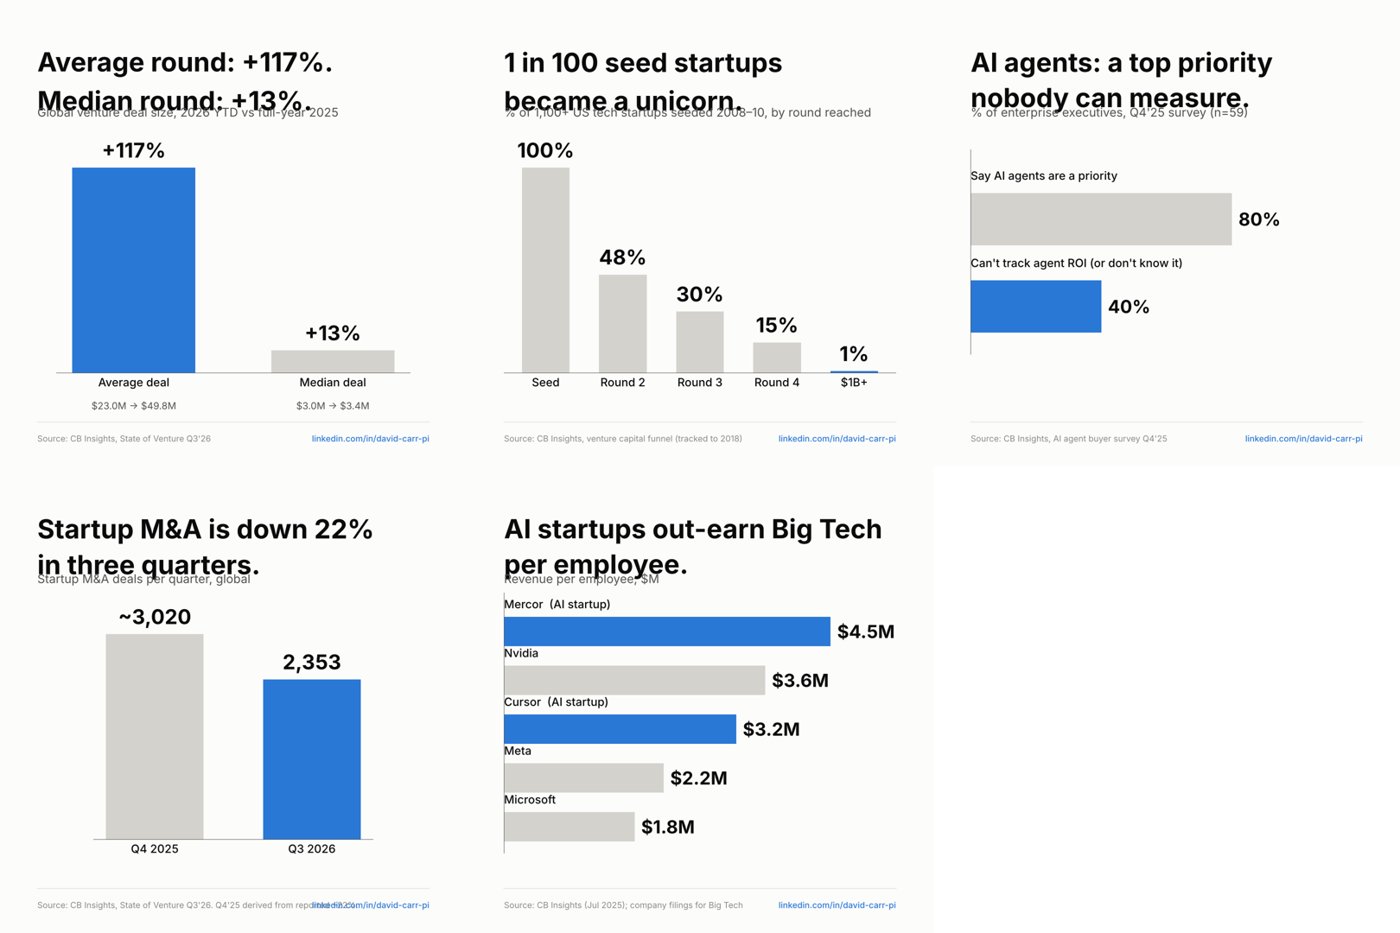
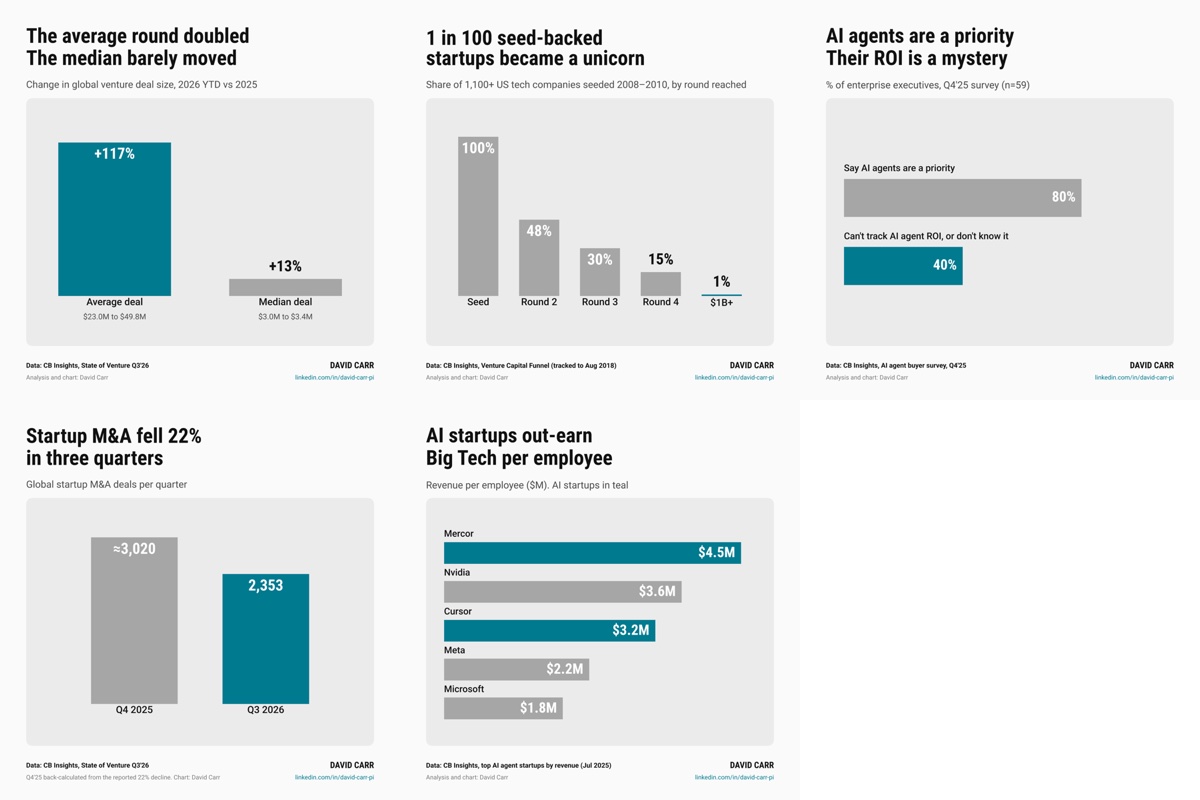
1. A paragraph on the chart. Too much reading.2. Clean, but in my colours, not theirs.3. CB Insights’ colours, but one number against one.4. Peter’s frame and key, many measures per chart.
One I couldn’t get right
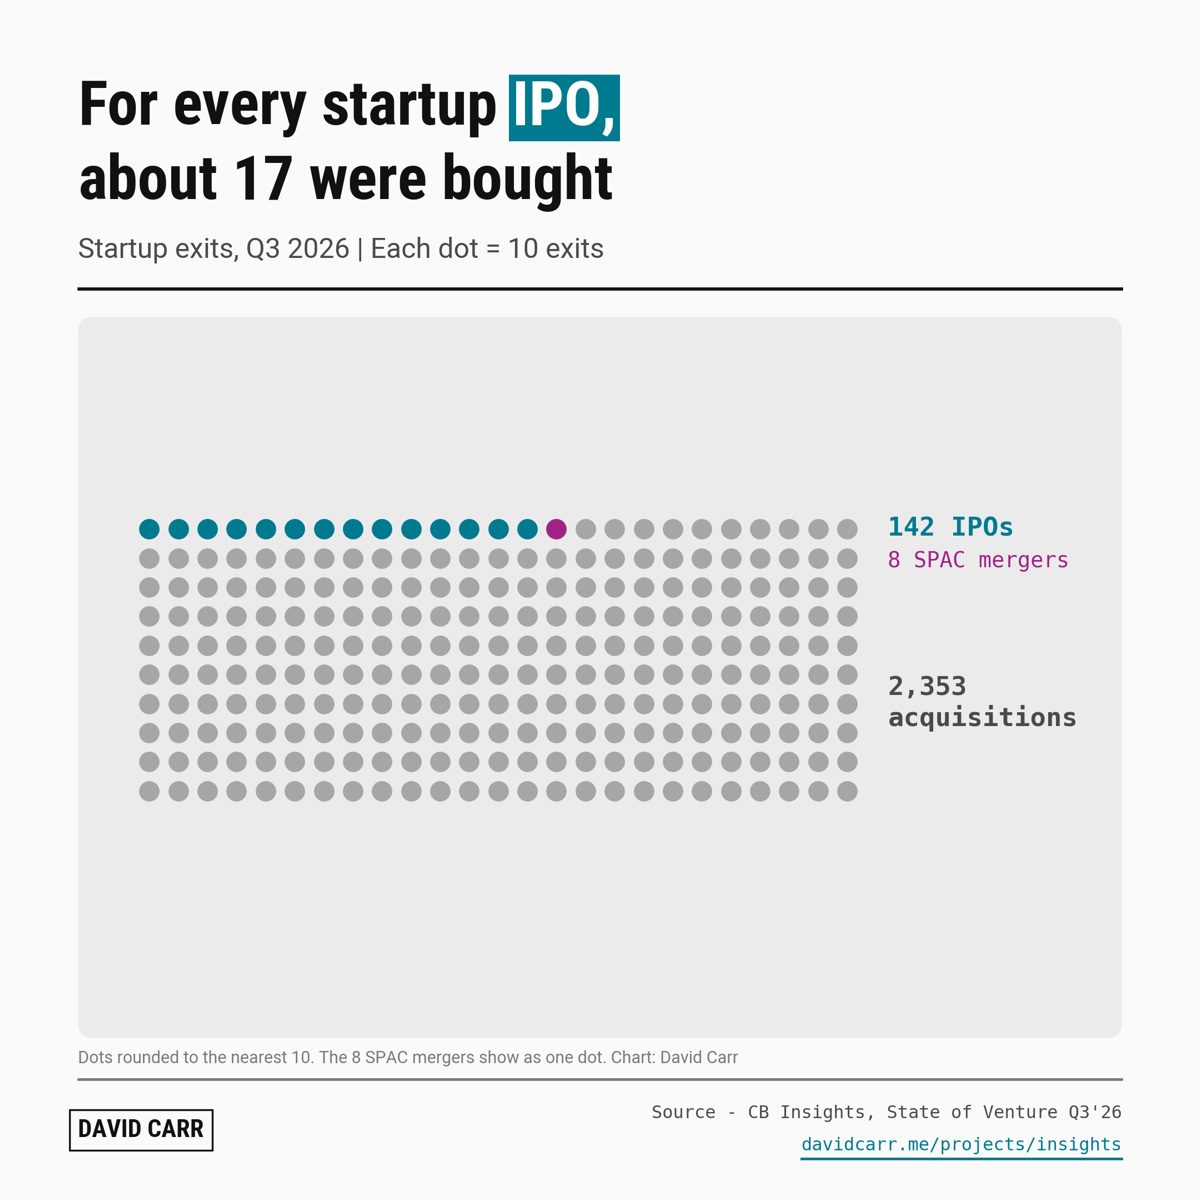
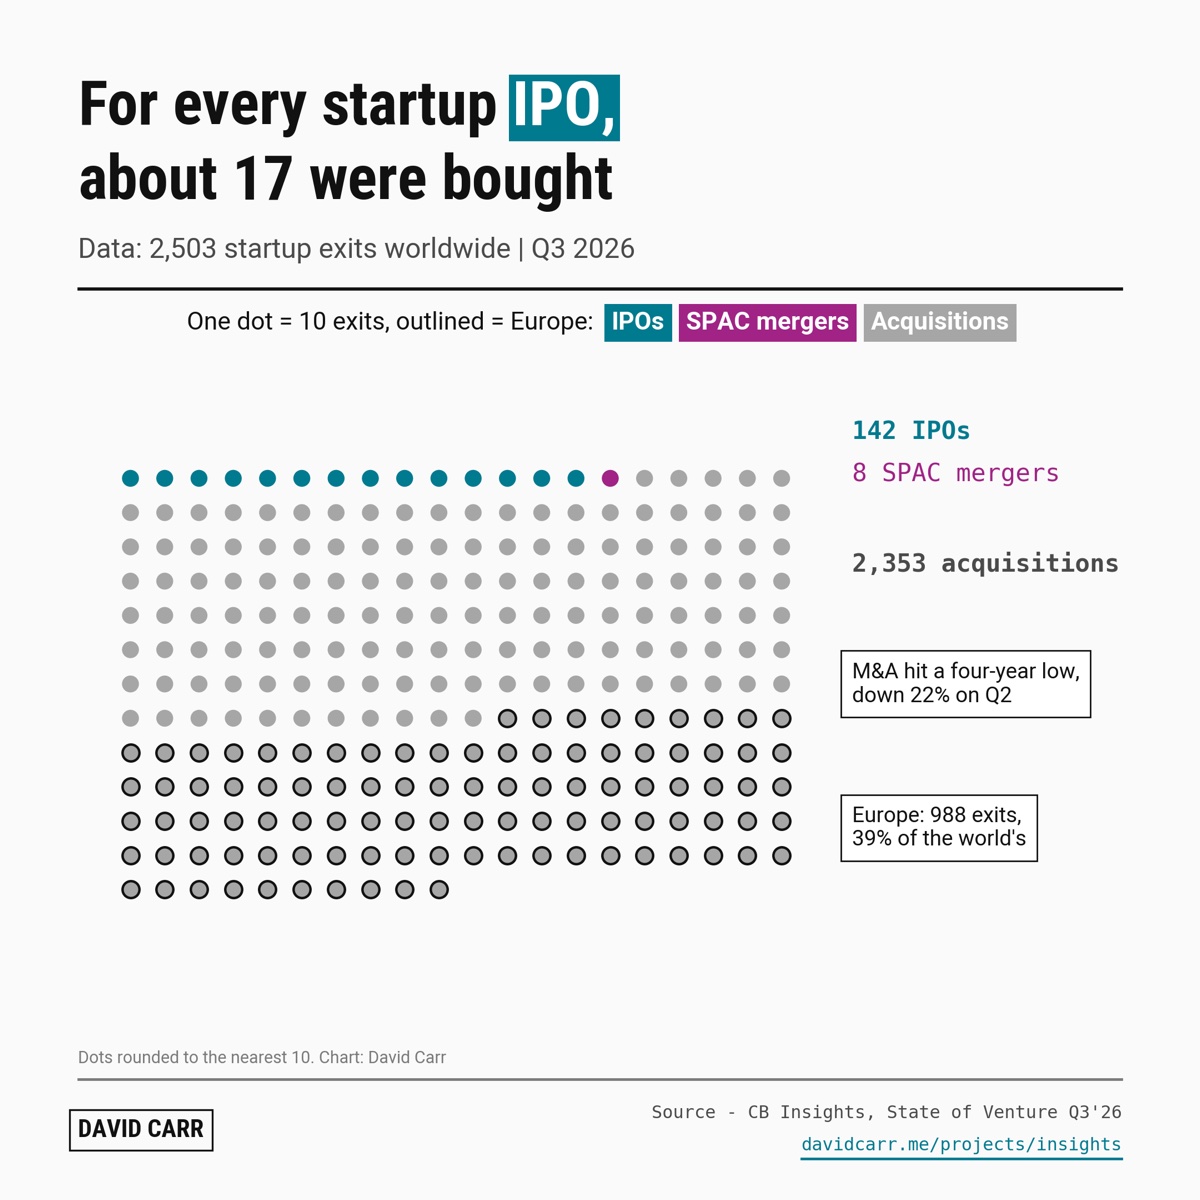
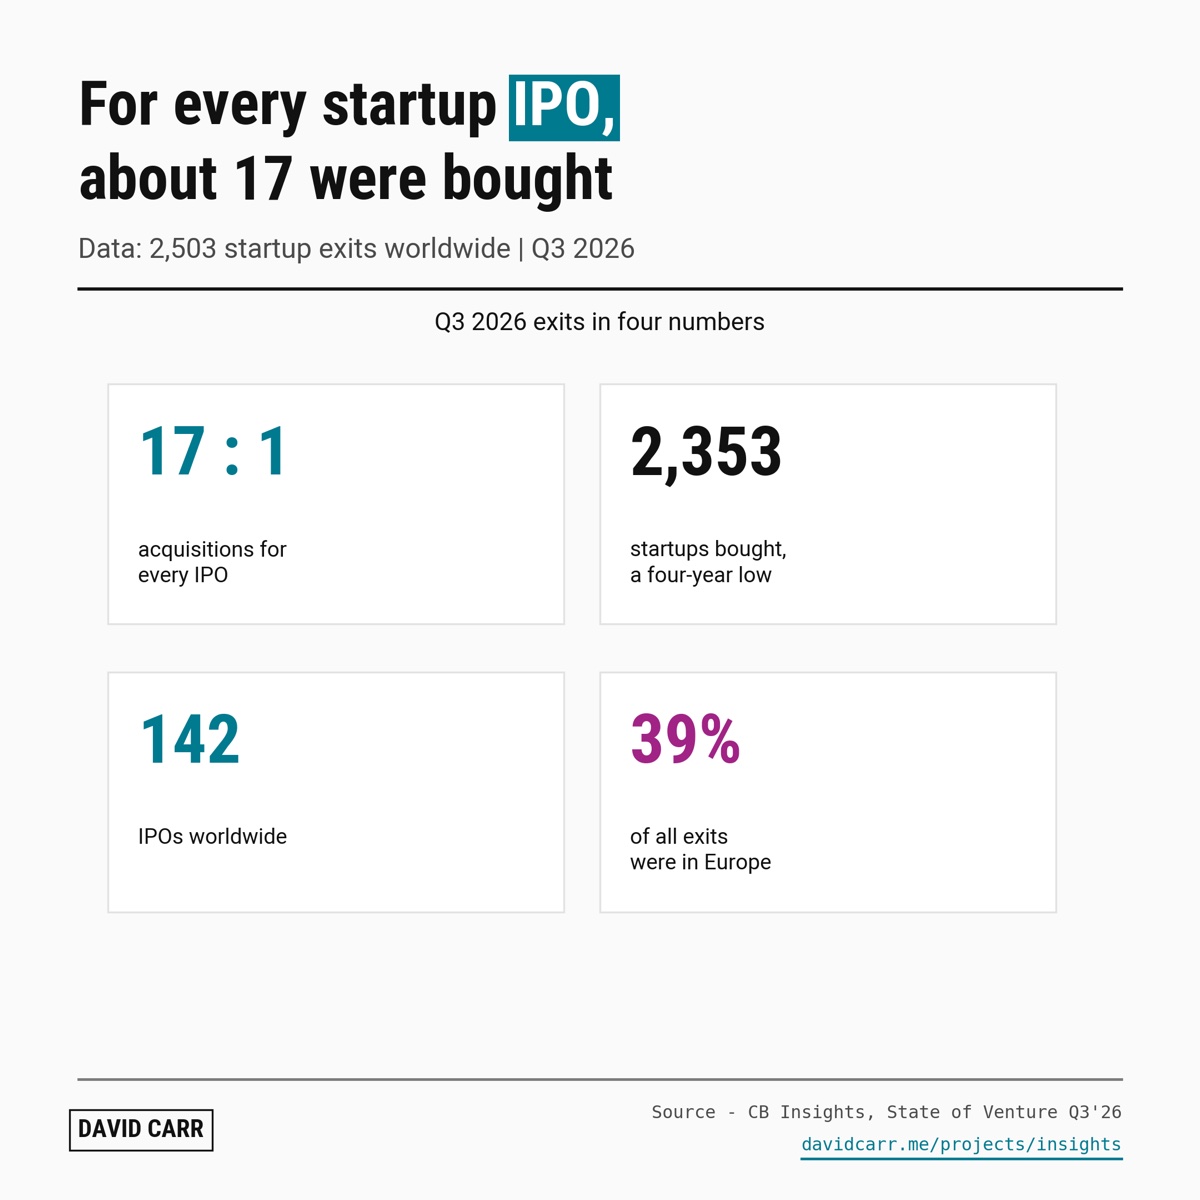
Startup exits. The story is good: about 17 acquisitions for every IPO. But every way I drew it ended up as one big number against a tiny one, or a chart that needed explaining. Here are my three tries. I’d love to know how you’d show it.
Why would corporate development care?Most exits are acquisitions, and this quarter there were fewer buyers. Less competition for each deal you want.
– · For corporate development
100% stacks: the world’s exits against Europe’s
142 startups went public in Q3 2026. 2,353 were bought.
Chart below splits every exit into acquisitions, IPOs and SPAC mergers, for the world and for Europe.
Acquisitions: 2,353 IPOs: 142 SPAC mergers: 8 Europe: 988 exits, only 15 of them IPOs
What this means
About 17 acquisitions for every IPO. Founders picture ringing the bell. Most exits are a sale.
And M&A just hit a four-year low, down 22% on Q2. Fewer buyers, so the ones still buying have more choice.
Counts from a news summary of State of Venture Q3’26. The four-year low and the 22% fall are from CB Insights’ own page.
Seven ideas that need the CB Insights platform. The question and the chart shape are here, with blanks where the numbers go. I haven’t made any up.
Why would investors care?Most funds still hold 2021 companies. This is how many of those are likely to come back.
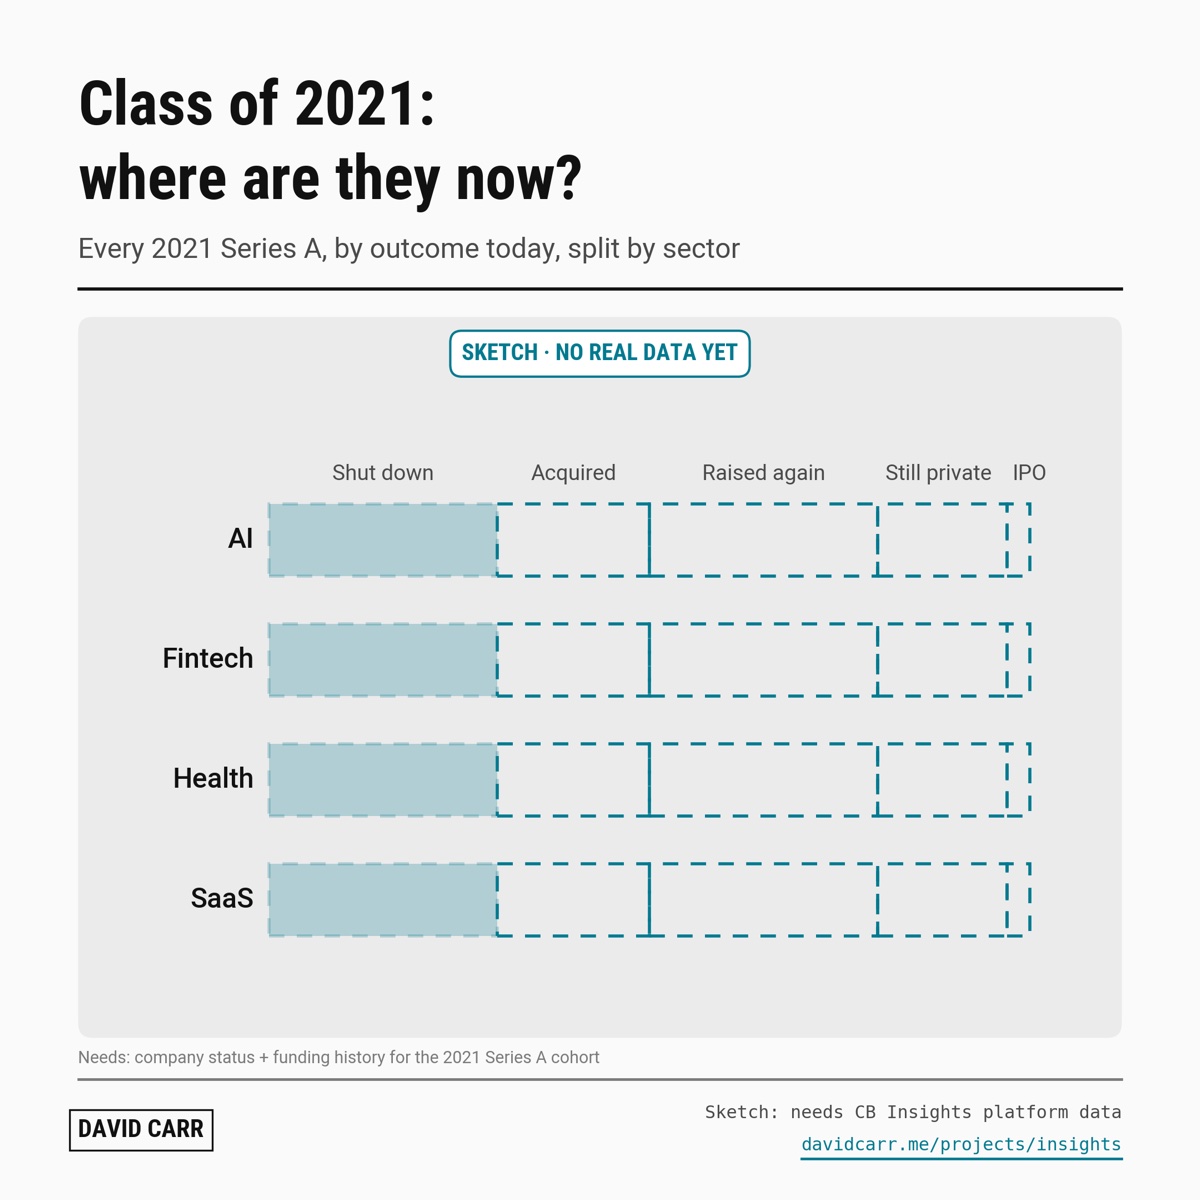
11 · Class of 2021: where are they now?
Sketch: needs platform data
We followed every startup that raised a Series A in 2021. Five years on: ___% have shut down, ___% were acquired, ___% raised again.
Chart below splits them by sector.
Why it’s worth posting
2021 was the peak. Investors still carry these companies on their books, and nobody has a clean count of how they did.
Peter’s most reused format. The sector split is the new angle.
Needs: company status and funding history for the 2021 Series A cohort, from the platform.
No numbers yet
Why would corporate development and founders care?It’s the base rate for any exit plan, by stage.
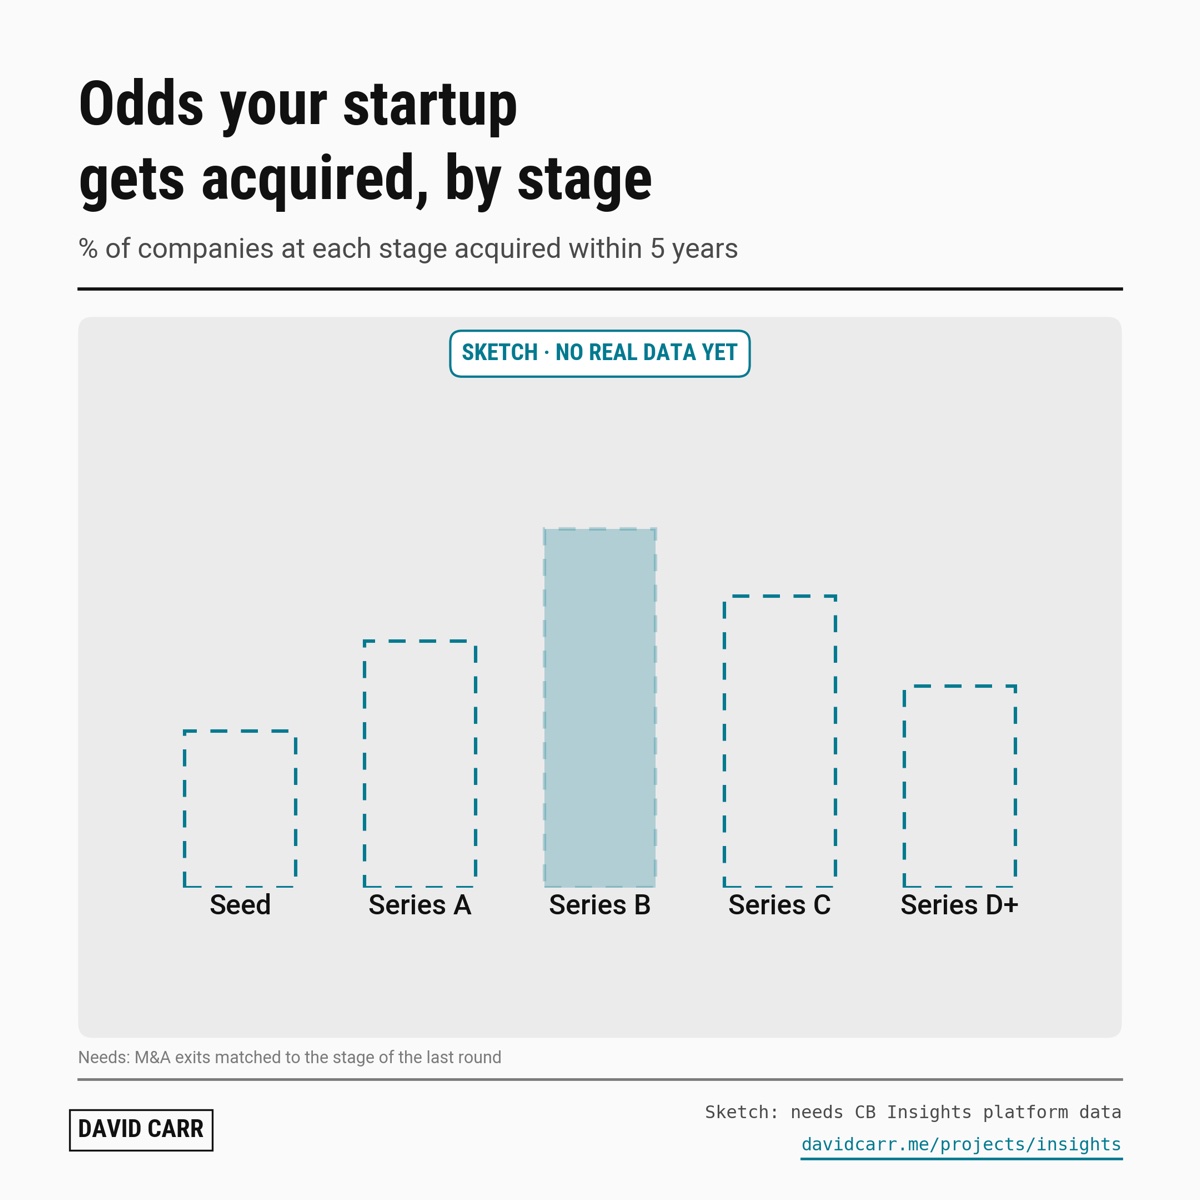
12 · Odds your startup gets acquired, by stage
Sketch: needs platform data
What are the odds your startup gets acquired? ___% at Seed. ___% at Series B.
Chart below shows the share of companies at each stage bought within five years.
Why it’s worth posting
Peter ran this on Carta’s data. CB Insights covers the whole market, not one cap table provider.
Founders and corporate development both want the base rate.
Needs: M&A exits matched to the stage of each company’s last round.
No numbers yet
Why would corporate development care?Know who you’re bidding against, and who has stopped.
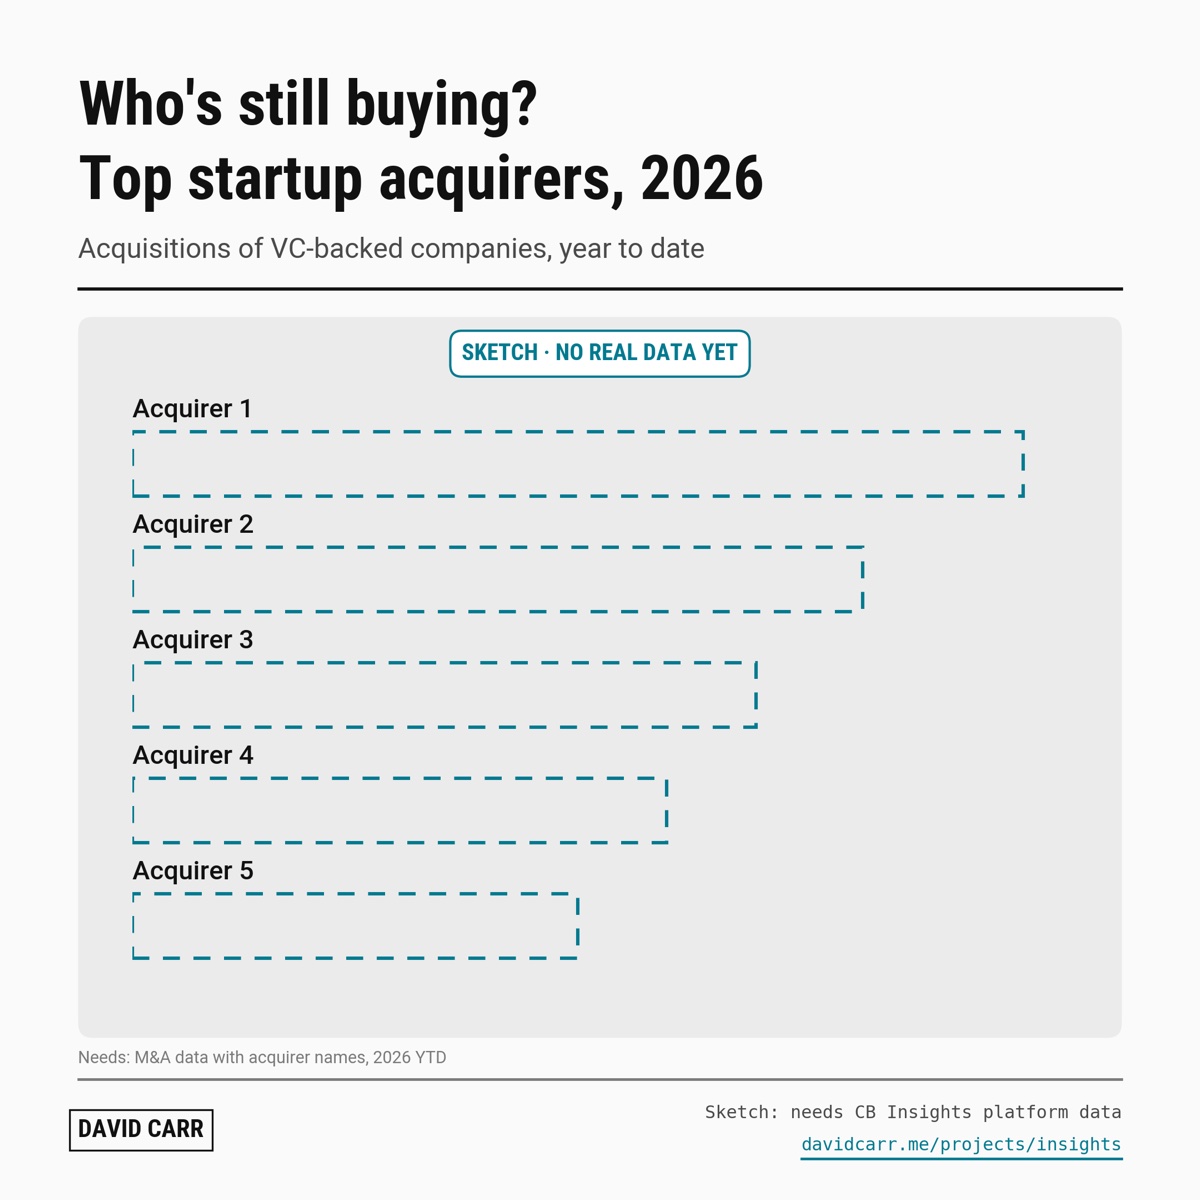
13 · Who's still buying? Top acquirers, 2026
Sketch: needs platform data
Startup M&A fell 22% last quarter. These ___ companies kept buying.
Chart below ranks the top acquirers of VC-backed startups, 2026 so far.
Why it’s worth posting
Corporate development teams want to know who they’re bidding against. Founders want to know who to call.
It answers the question Carta’s data can’t: who is buying.
Needs: 2026 M&A data with acquirer names.
No numbers yet
Why would VCs care?The best founders are found before they announce. Following where they worked is how.
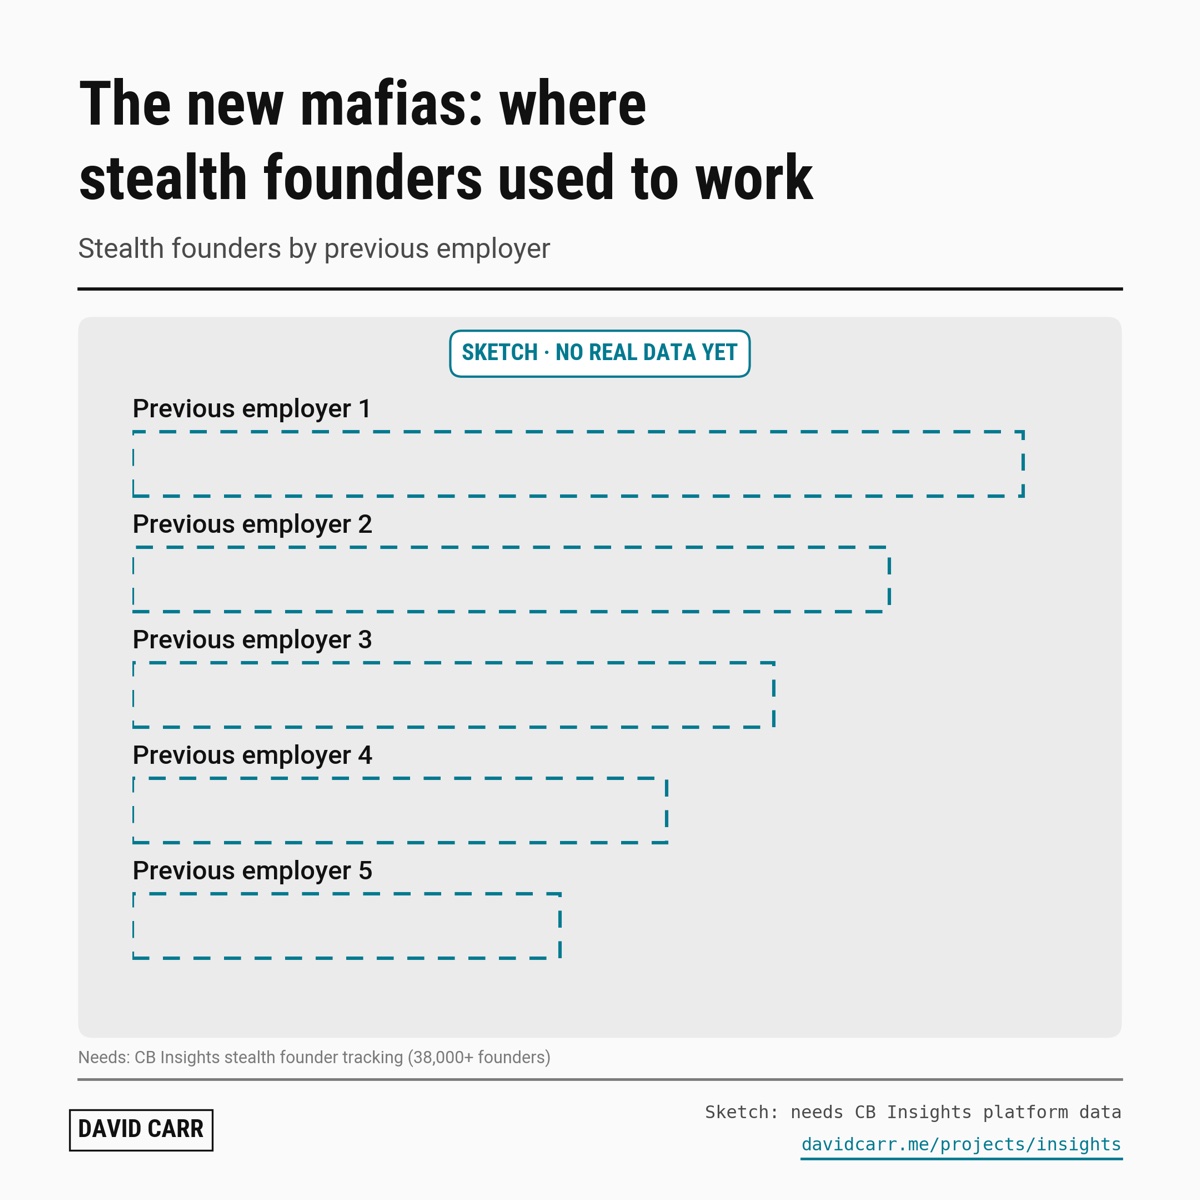
14 · Where stealth founders used to work
Sketch: needs platform data
___ founders in stealth used to work at ___. That’s the new mafia.
Chart below ranks previous employers of founders building in stealth.
Why it’s worth posting
VCs source deals by following talent. This is a list they’d screenshot.
It uses CB Insights’ stealth founder tracking, which nobody else has.
Needs: CB Insights’ stealth founder data.
No numbers yet
Why would strategy teams care?One prompt instead of a day of desk research on a competitor.
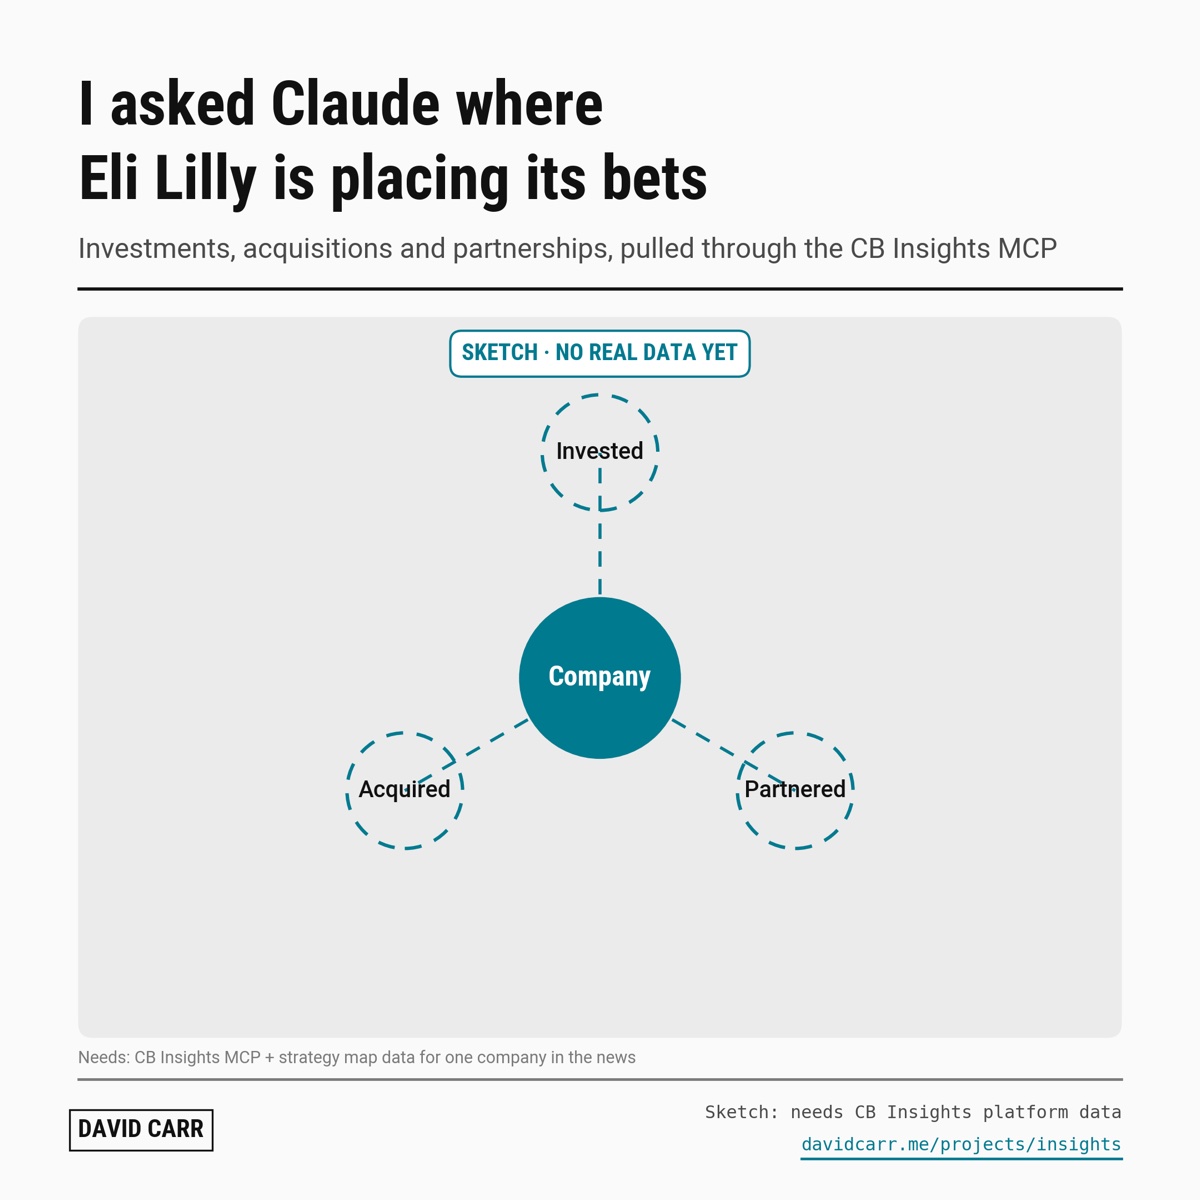
15 · Where is Eli Lilly placing its bets?
Sketch: needs platform data
I asked Claude where Eli Lilly is placing its bets. It pulled ___ investments, ___ acquisitions and ___ partnerships from CB Insights in one go.
Chart below maps them.
Why it’s worth posting
The strategy map is CB Insights’ best-performing format on LinkedIn: their Eli Lilly post got 2,330 reactions.
Building it live through the MCP shows the product while telling the story.
Needs: CB Insights MCP access. Pick whichever big company is in the news that week.
No numbers yet
Why would founders and investors care?Every runway plan depends on how long the next round takes.
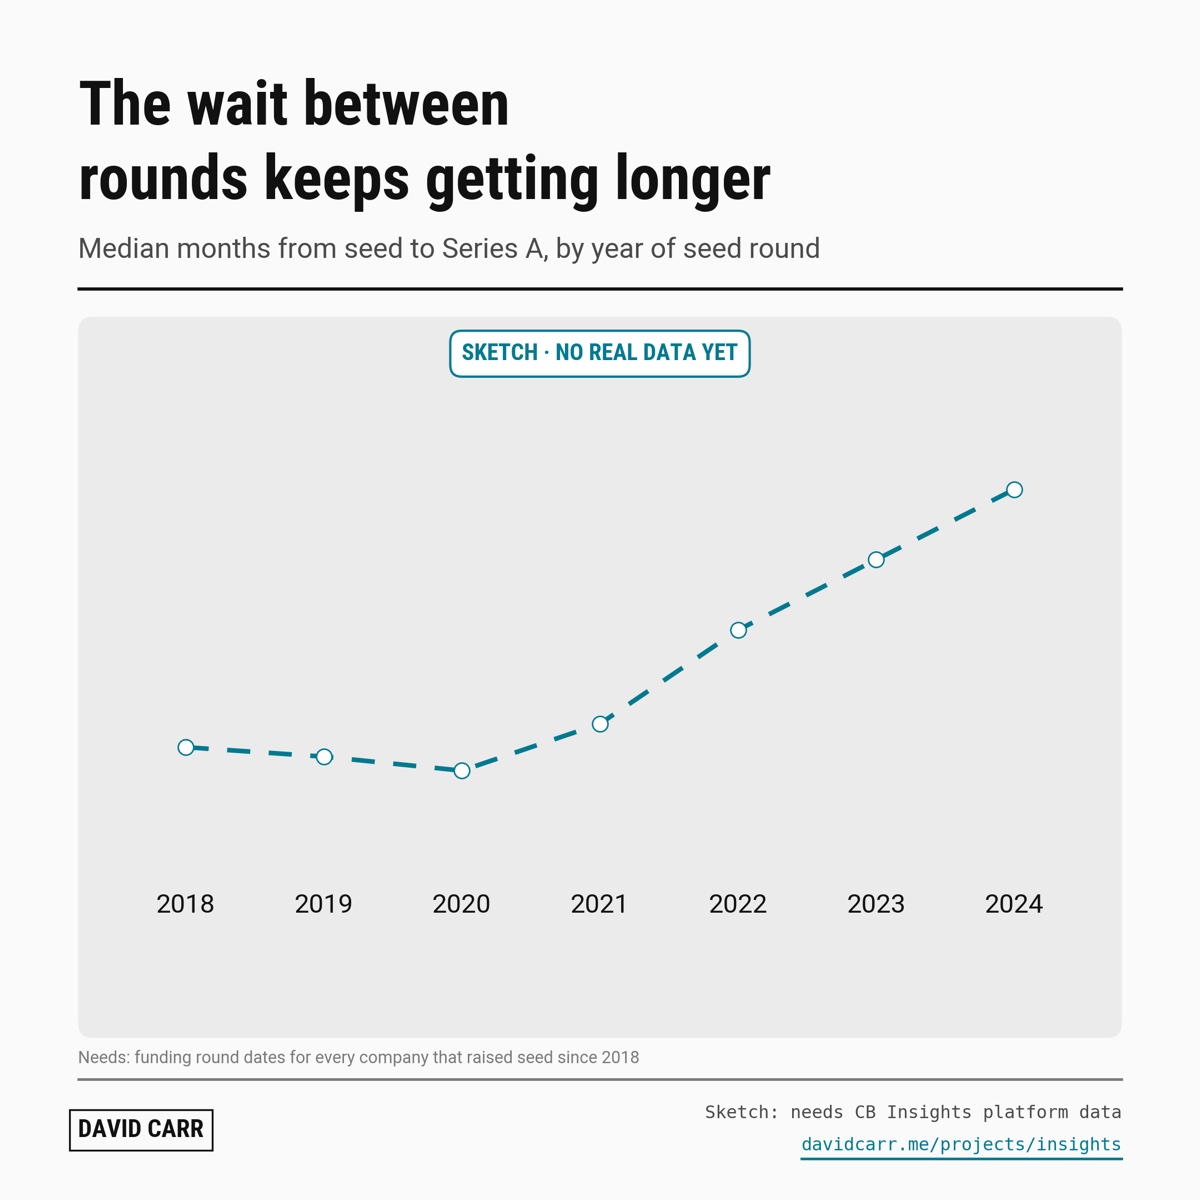
16 · The wait between rounds keeps getting longer
Sketch: needs platform data
The median wait from seed to Series A is now ___ months. In 2018 it was ___.
Chart below shows the median gap by year of the seed round.
Why it’s worth posting
Founders plan their runway around this number. Peter’s version showed the old 18 to 24 month rule had broken. CB Insights could run it for the whole market.
It can run every quarter.
Needs: round dates for every company that raised a seed round since 2018.
No numbers yet
Why would enterprise buyers care?Vendors in overfunded, little-used markets are the ones most likely to disappear.
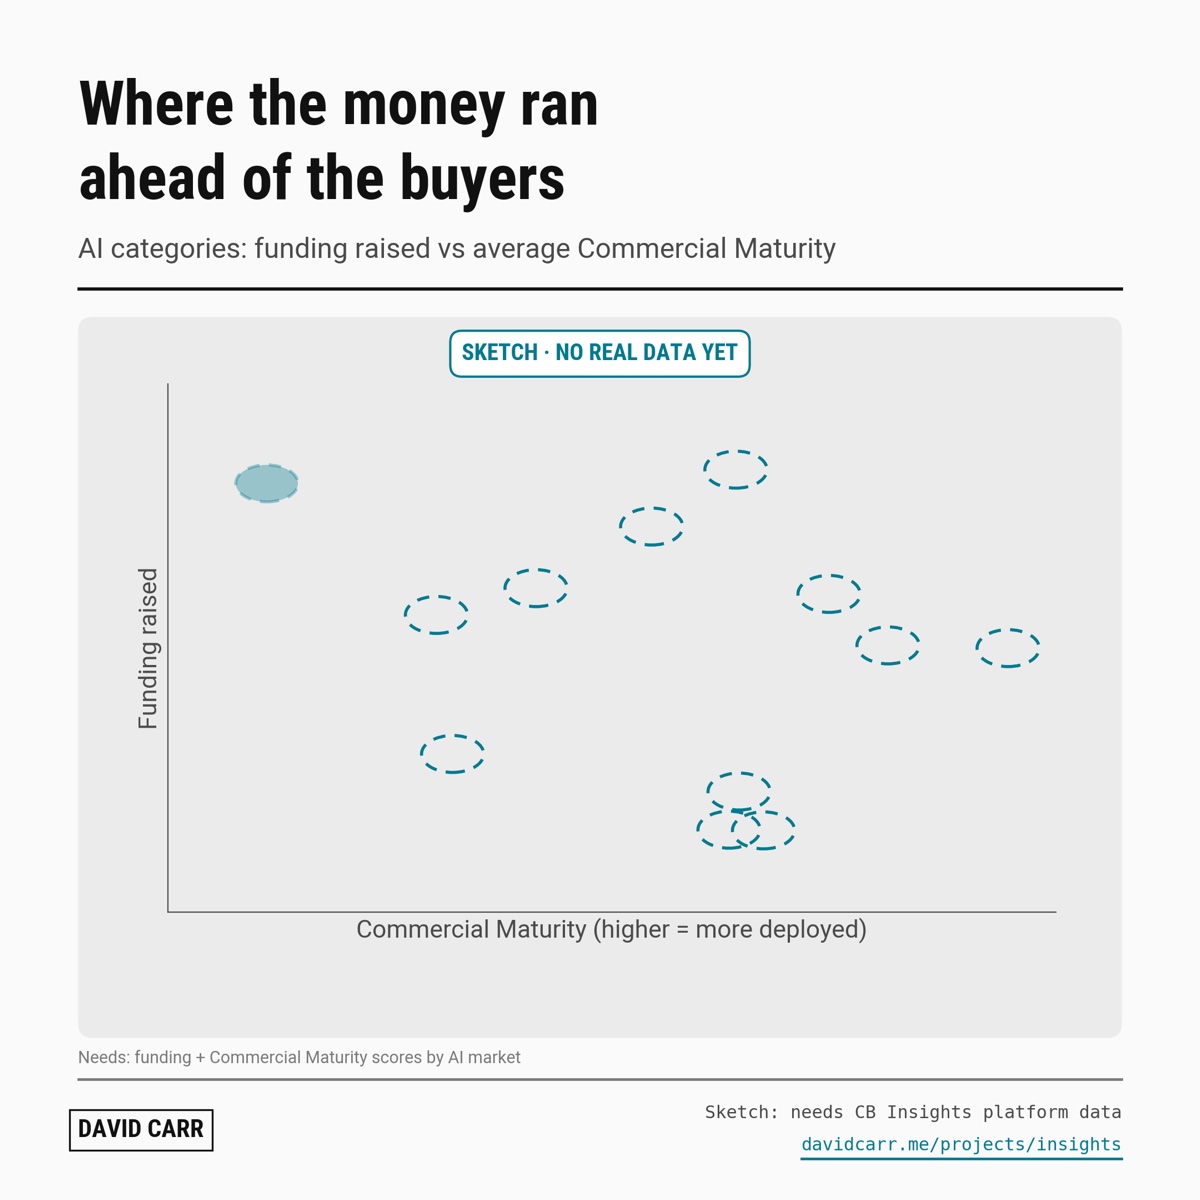
17 · Where the money ran ahead of the buyers
Sketch: needs platform data
These AI markets raised $___B. They score lowest on Commercial Maturity.
Chart below plots funding against how widely each market is actually deployed.
Why it’s worth posting
Enterprise buyers want to know which vendors will last. Commercial Maturity is a score only CB Insights has.
Top left of the chart is where the hype is.
Needs: funding and Commercial Maturity scores by AI market.
No numbers yet
What I cut
Five findings that are only one number against one other. Real, but a chart with two bars isn’t worth posting. Each says what it needs before it earns a chart.
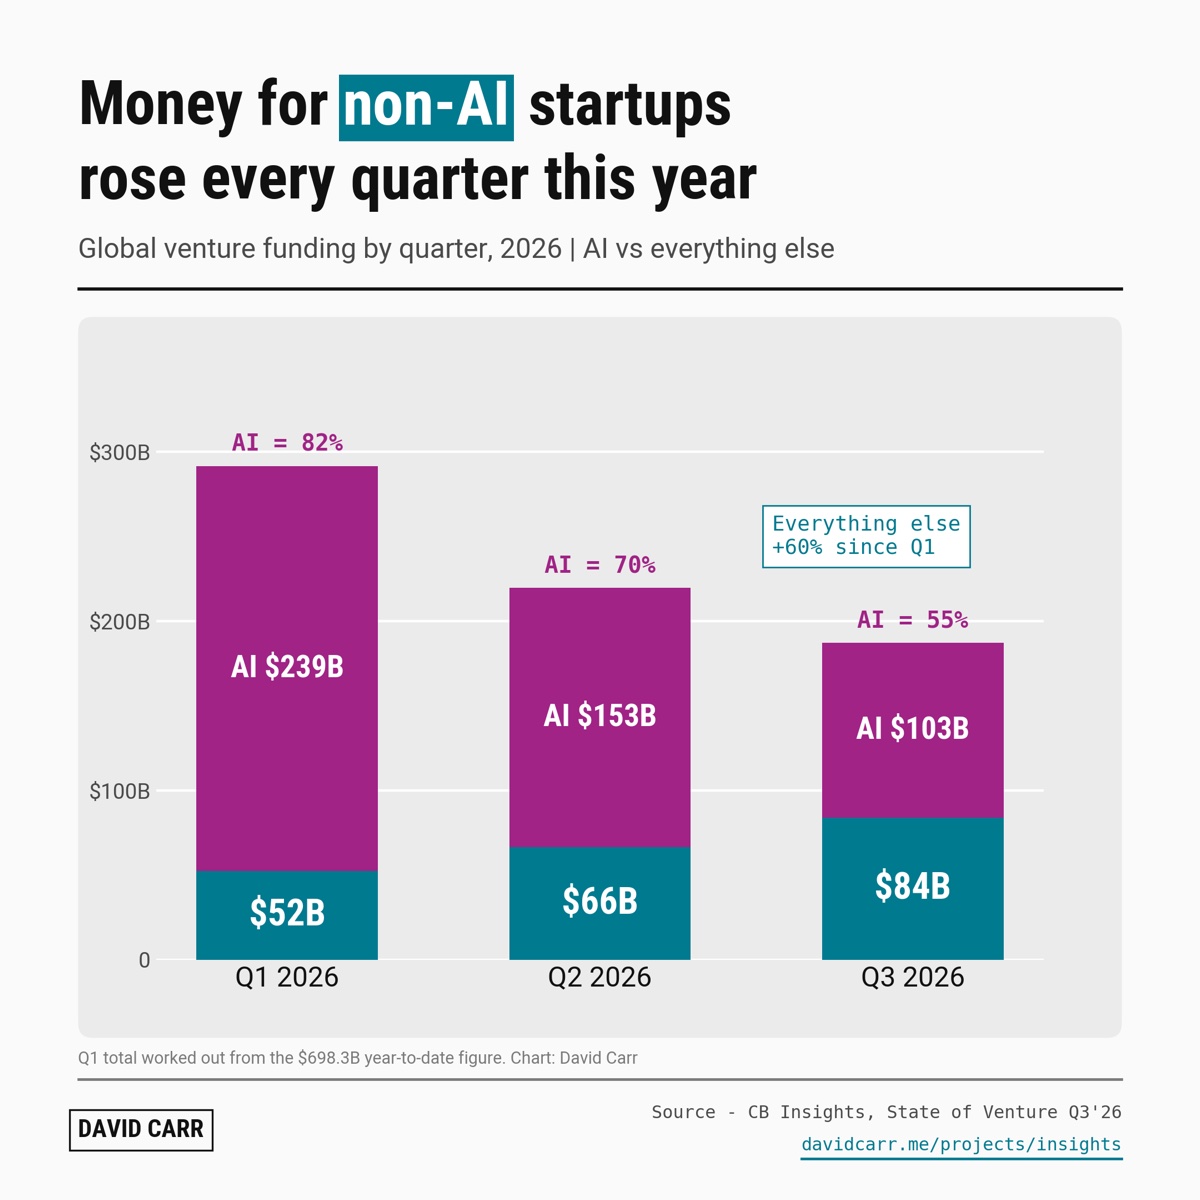
AI money tripled in a quarter. AI deals fell. Needs the last eight quarters, so the jump sits inside a trend.
The US gets 91% of AI money from half the deals. Needs every quarter and the next five countries.
Big Tech buys AI startups 3 years sooner. Needs years to exit by buyer type and stage.
Customer service agents trade at 127x revenue. Needs multiples for every agent category, with 2026 data.
142 rounds took 89% of all AI money. Needs the mega-round share by quarter, AI against everything else.
Checked against Peter’s rules
Where I’m following them, and where I’m not yet.
Rule
How I did
More than one against one
The best five carry four to twelve data points each. Anything with only two bars is parked.
His post structure
All of them: claim, chart below, numbers, what this means, caveats, close.
Sample in the subtitle
Every chart: “Data: N ... | period”.
One frame, annotated
Same header and footer on every chart. Key words boxed instead of a legend. Brackets, boxed notes and side notes point at the thing to see.
Facts vs guesses
Guesses are marked. Worked-out numbers say so.
Cohorts and spreads
Weakest area. Only chart 09 is a cohort, and it’s from 2008 to 2010. Spreads need stage-level data.
Primary sources
Most of the best five lean on one news summary of the Q3’26 report. I checked it wherever I could: its quarterly deal counts add up exactly to CB Insights’ own figure.
Every number and its source
Each chart has a CSV: label, value, unit, source, link, and whether the source is primary (CB Insights published it) or secondary (a news site summarised one of their gated reports). The full list is in SOURCES.md.